6. Diagnosis Mode
6.1. Overview
EC-Engineer is also a diagnosis application specifically developed to analyze EtherCAT networks that are controlled by the EC-Master. Automated control systems usually require high availability of the whole system. Due to the rough industrial environment this is often hardly to achieve.
If high availability shall be guaranteed for an automated control system it is important to verify and maintain the field bus. Using EC-Engineer it is possible to take a look into the “health” of the EtherCAT system. Detection of signs of system degradation prior to running into a system failure will be of great benefit. In that case it is possible to exchange the problematic components (cables, slave devices).
- Many aspects of diagnosis are covered by the EC- Engineer:
Useful for setting up the system
System analysis and maintenance
Error detection
Documentation
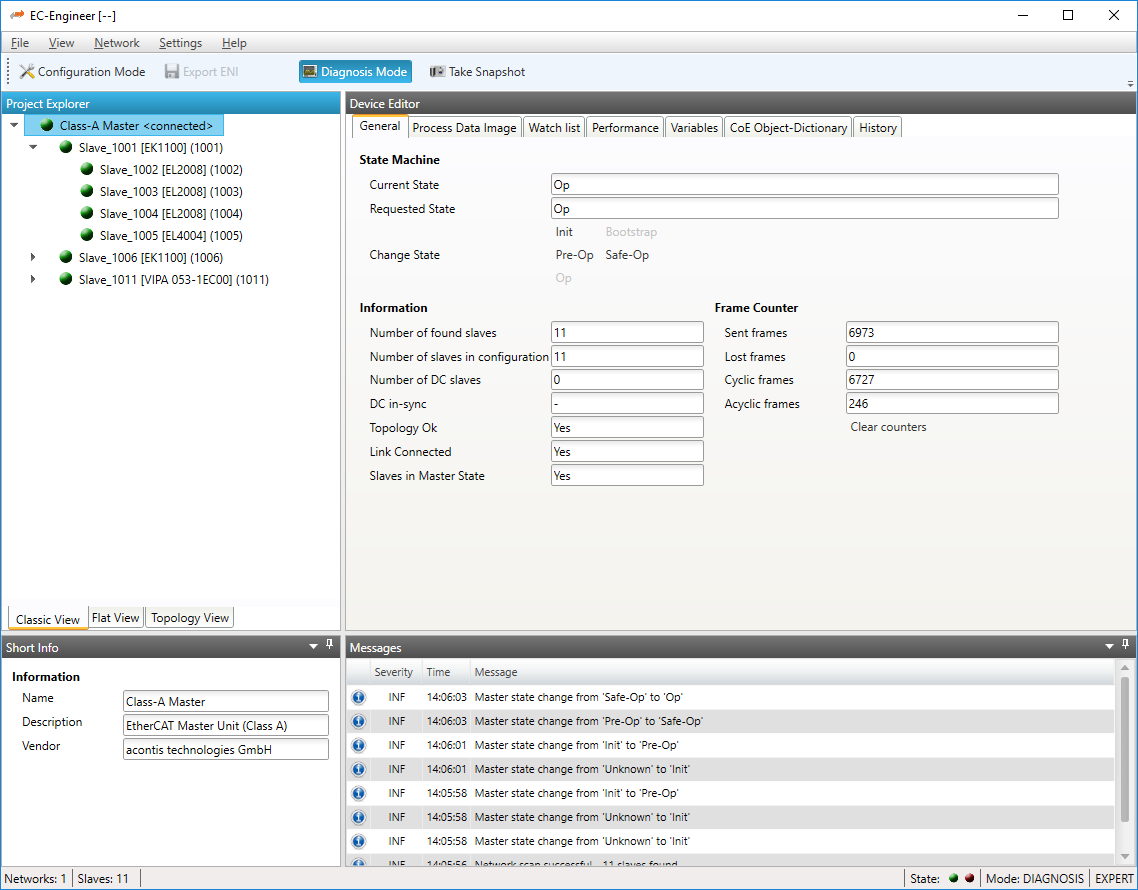
- After switching into diagnosis mode of EC-Engineer, the user will see this page:
6.2. Master
This section shows the current “health” state of the master and helps the user to analyze master related problems.
6.2.1. General (Master)
- In this tab, the user can see and change the current state of the state machine of the master. He has also an overview over the current “health” state of his EtherCAT network:
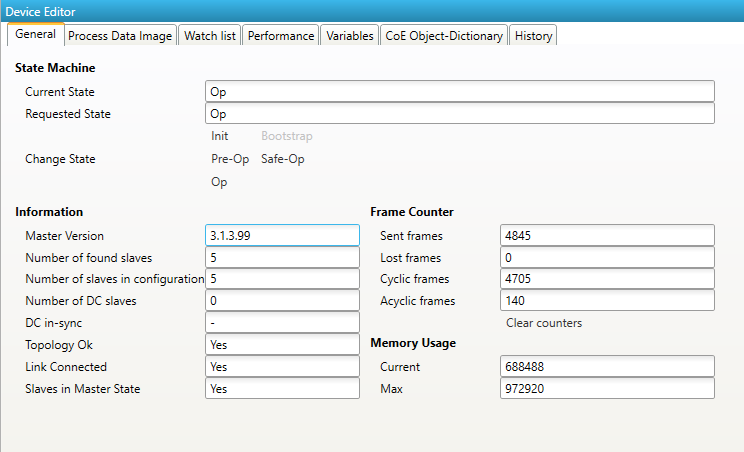
- State Machine
- Current State:
Current state of the master
- Requested State:
Requested state of the master
- Change State:
Master can reach the states INIT, PRE-OP, SAFE-OP and OP.
- Information
- Master version:
Version number of the running master
- Number of found slaves:
Number of slaves, which were found from master on the network
- Number of slaves in configuration:
Number of slaves, which are configured in the
ENIfile- Number of DC slaves:
Number of slaves with DC support, which were found from master on the network
- DC in-sync:
Signals that all slaves with DC support are correctly synchronized or not. If not all slaves are correctly synchronized, please refer the Message Window for more information.
- Topology OK:
Signals that topology is “okay” or not. If topology is not “okay”, you have a mismatch between the configured bus and the currently connected bus. Please open the ‘Network Mismatch Analyzer’ (Menu Network Network Mismatch Analyzer) to solve the problem.
- Link Connected:
Signals the link is connected.
- Slaves in Master State:
Signals that all slaves are in master state.
- Frame Counter
- Sent frames:
Number of sent frames
- Lost frames:
Number of lost frames
- Cyclic frames:
Number of cyclic frames
- Acyclic frames:
Number of acyclic frames
- Memory Usage
- Current:
Current memory usage in bytes
Max:
6.2.2. Process Data Image
- In this tab, the user can see and change the values of the process variables. The variables will be forced to the value the user entered. The user can press release to release the variable. If one or two variables are selected, a chart of the values is shown. Also resize and zoom is possible to see more details. The chart will be updated every 250 milliseconds:
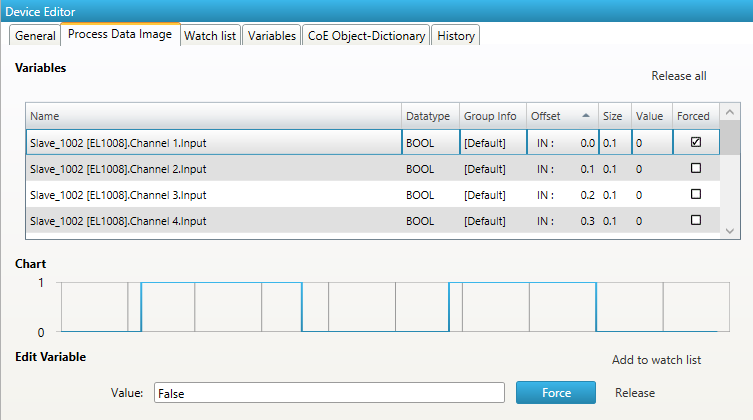
It is also possible to add the variables to a watch list (next chapter).
6.2.3. Watch list
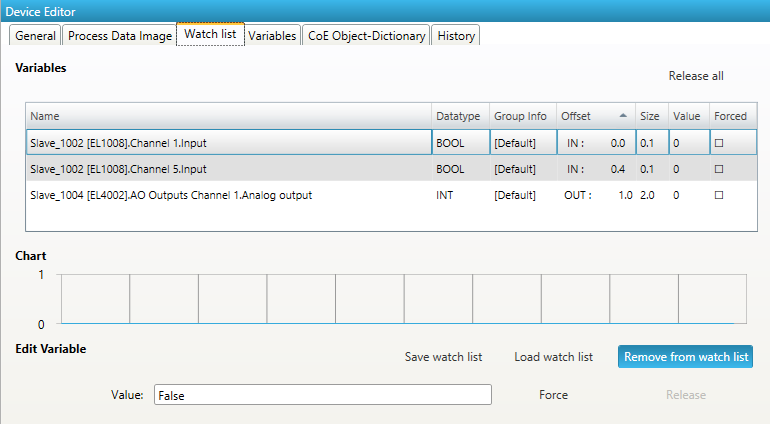
- In this tab, the user can monitor selected variables. He can go through the slaves and add variables to the watch list to monitor them. The user can also export or import the watch list, so changes can be saved:
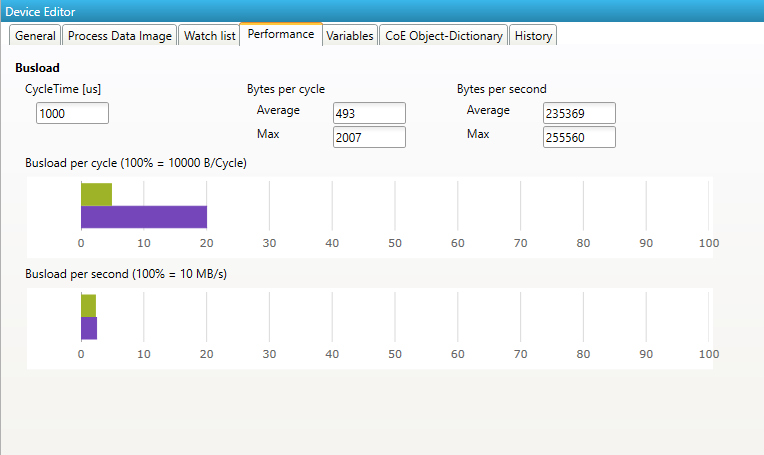
6.2.4. Performance
- This tab is split into two sub tabs. On one the user can see the busload per cycle and per second:
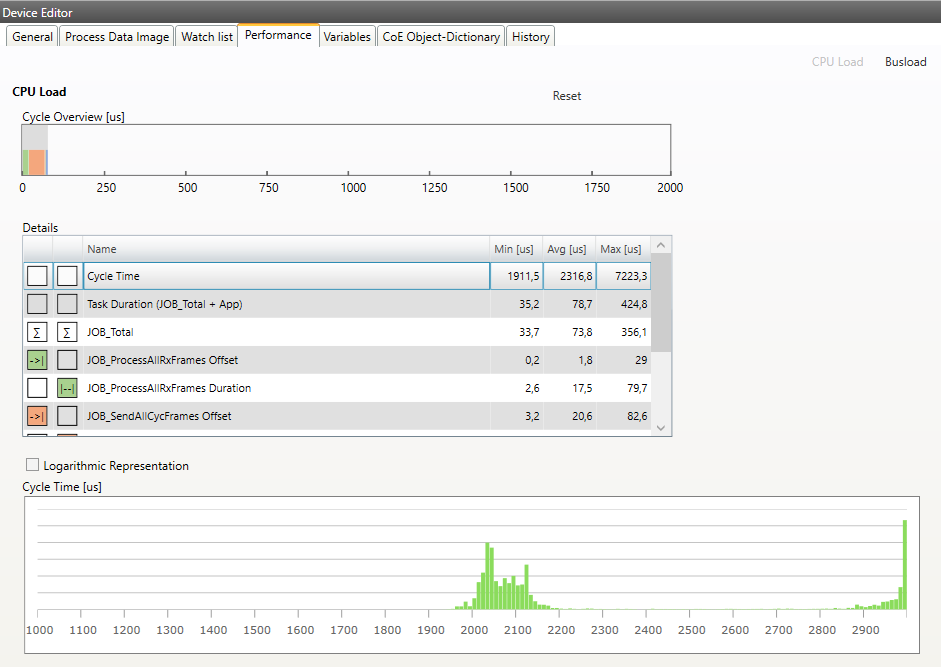
- On the other tab the user can the CPU load. In the grid is a list of all running jobs and how long they take. In the diagram above is a summary of all jobs. When a job is selected, the chart shows how many times a job has taken how long to complete.
6.2.5. Trace Data (Expert)
- In this tab, the user can see and change the values of the trace variables. If he selects a variable he will see a chart of the values. The chart will be updated every 250 milliseconds:
6.2.6. CoE Object-Dictionary (Expert)
- In this tab, the user can see and change the values of the object dictionary of the master:
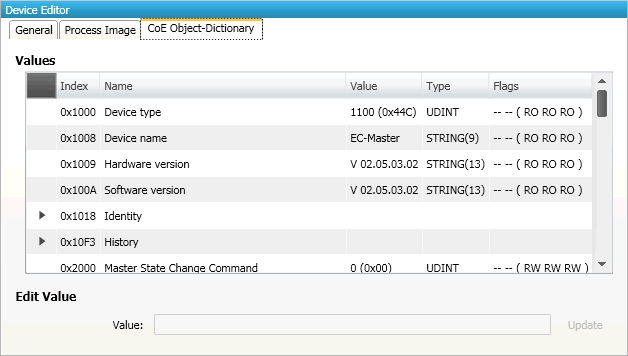
- Lists of CoE Object-Dictionary entries
Entries are uploaded by the master from the slave
- The “Flags” column tells the user if this entry is an PDO entry and if it can be edited
“AA BB (CC DD EE)”
AA = Mapping as RX PDO or not
BB = Mapping as TX PDO or not
CC = Access rights for PreOp (RO, WO, RW)
DD = Access rights for SafeOp (RO, WO, RW)
EE = Access rights for Op (RO, WO, RW)
- Buttons
- Update:
Changes the selected entry
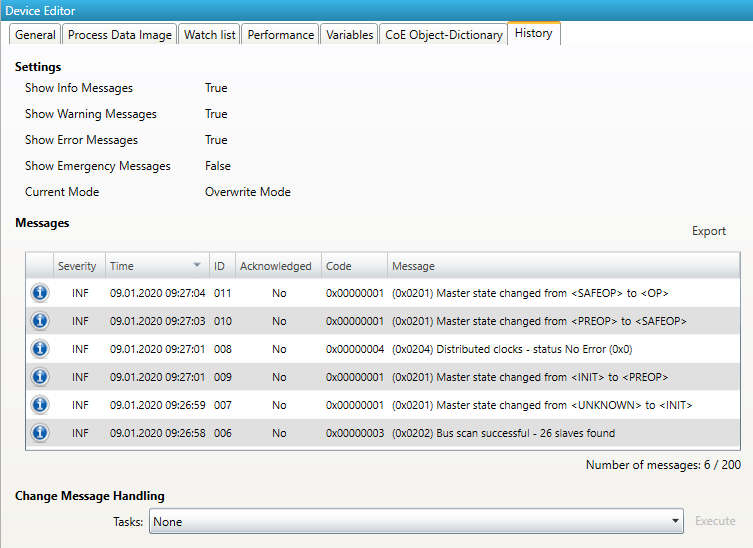
6.2.7. Master History (Expert)
- In this tab, the user can see and change the diagnosis history of the master (Supported from EC-Master V2.7 and above). It is also possible to export the data:
6.3. Slave
This section shows the current “health” state of the selected slave and helps the user to analyze slave related problems.
6.3.1. General (Slave)
- In this tab, the user can see and change the current state of the state machine of the slave. He can see and clear also the current error state of the slave:
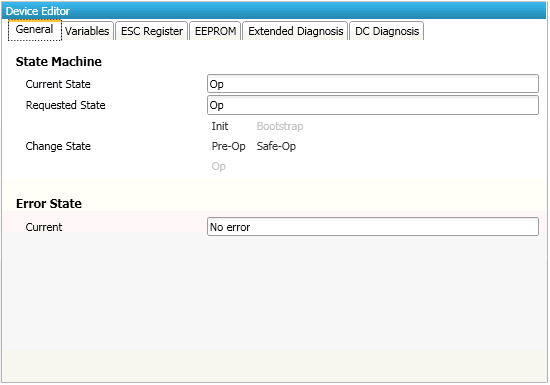
- State Machine
- Current State:
Current state of the selected slave
- Requested State:
Requested state of the selected slave
- Change State:
Slave can reach the states INIT, BOOTSTRAP, PRE-OP, SAFE-OP and OP. Note: The BOOTSTRAP mode can only be reached from the INIT state.
- Error State
- Current:
Slave error which occurred during state transition
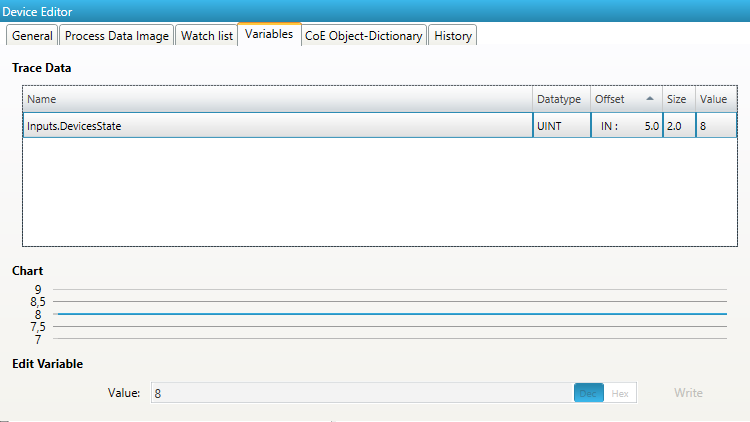
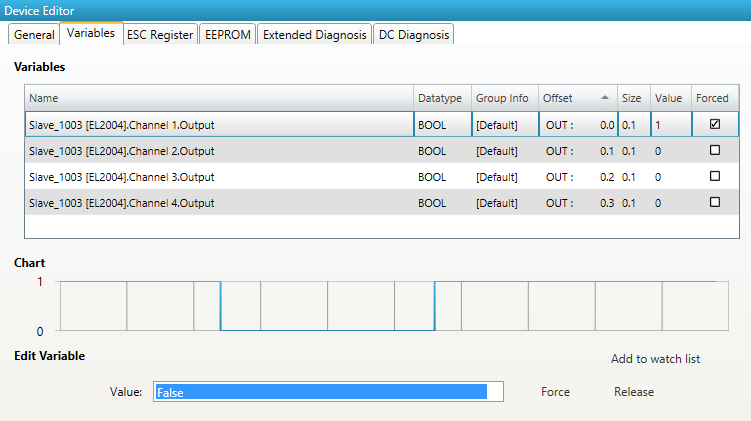
6.3.2. Variables
- In this tab, the user can see and change the values of the process variables. The variables will be forced to the value the user entered. The user can press release to release the variable. If one or two variables are selected, a chart of the values is shown. Also resize and zoom is possible to see more details. The chart will be updated every 250 milliseconds:
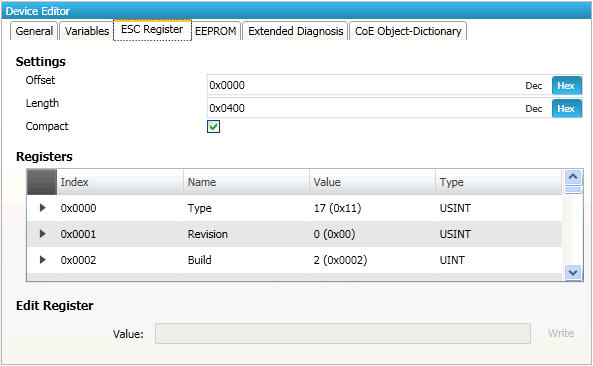
6.3.3. ESC Register (Expert)
- In this tab, the user can see and change the values of the registers. In the settings section he can set the offset and the length. If he activates the compact view, he will only see the registers which have a description:
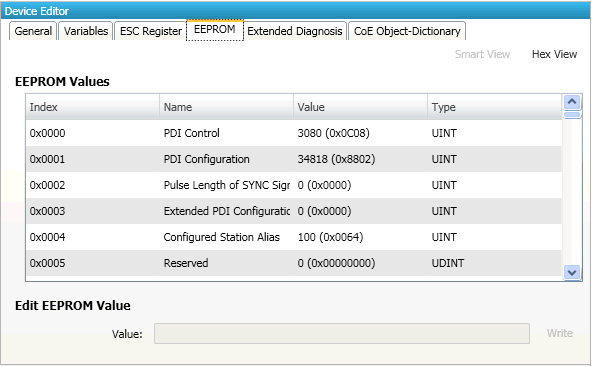
6.3.4. EEPROM (Expert)
This tab consists of 2 views:
- Smart View
In this view, the user can see and change the values of the EEProm.
- Hex View
In this view, the user can create an EEPROM from an
ESIfile, upload the EEPROM from the slave, load an EEPROM from the disk, download the EEPROM to the slave or save the EEPROM to disk.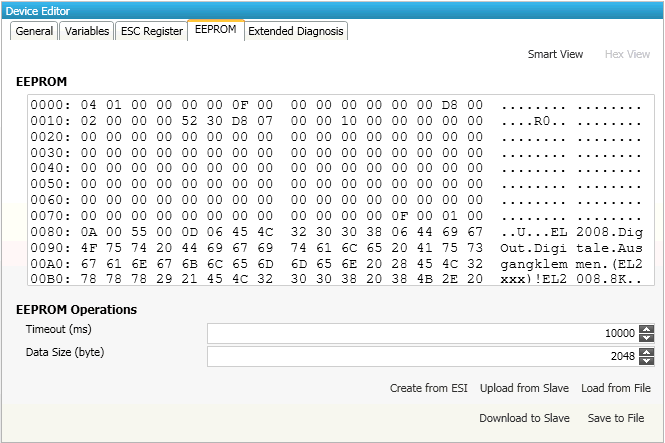
6.3.5. Extended Diagnosis (Expert)
- In this tab, the user can see the extended diagnosis information:
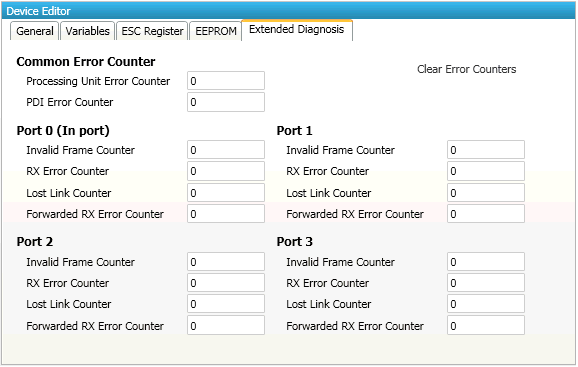
- Common Error Counter
- Processing Error Counter:
Indicates that slave received “not EtherCAT frames”, which are not allowed in the EtherCAT segment (of course acceptable in a test environment)
- PDI Error Counter:
Counts if a PDI access has an interface error (read from register: 0x30D)
- Port 0..3
Invalid Frame Counter of Port y (read from register: 0x0300+y*2)
RX Error Counter of Port y (read from register: 0x0300+y*2+8Bit)
Lost Link Counter of Port y (read from register: 0x0310+y)
Forwarded RX Error Counter of Port y (read from register: 0x0308+y)
Note
All error counters can be cleared by clicking on Clear Error Counters of the context menu of the master.
6.3.6. DC Diagnosis (Expert)
- In this tab, the user can see all DC related values of the slave:
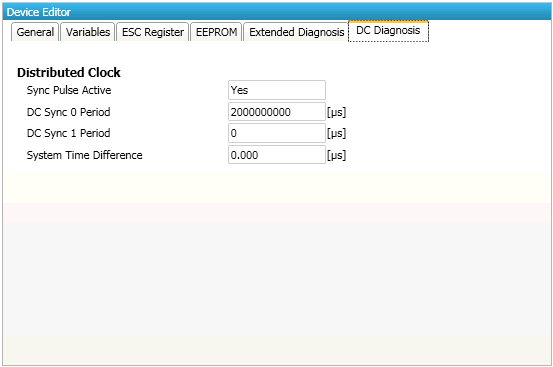
Note
The option “Sync Window Monitoring” must be enabled (see config-mode:Variables (Expert)).
6.3.7. CoE Object-Dictionary
This tab consists of 3 modes (in user mode, only the description from ESI or slave is available):
- Description from
ESI In this tab, the user can see the description of the object dictionary from
ESIand the values from the slave. He can also change the values.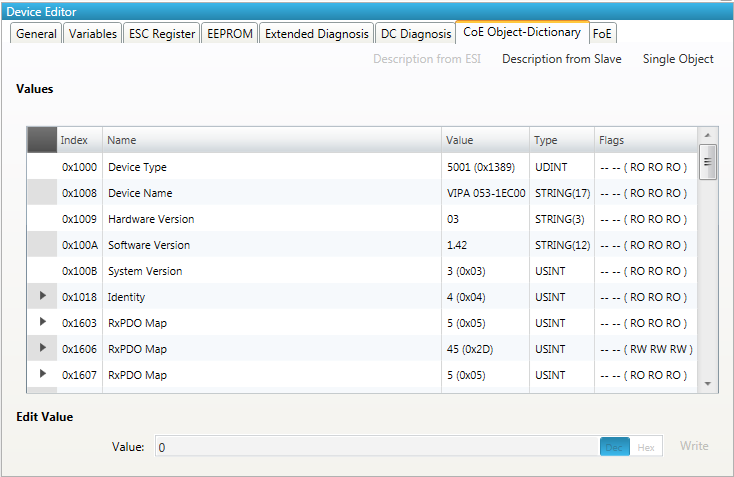
- Lists of CoE Object-Dictionary entries
Entries comes from
ESI- The “Flags” column tells the user if this entry is an PDO entry and if it can be edited
“AA BB C D (EE FF GG)”
AA = Mapping as RX PDO or not
BB = Mapping as TX PDO or not
C = Backup Flag
D = Settings Flag
EE = Access rights for PreOp (RO, WO, RW)
FF = Access rights for SafeOp (RO, WO, RW)
GG = Access rights for Op (RO, WO, RW)
- Buttons
- Write:
Writes the selected entry
- Description from Slave
In this tab, the user can see the description of the object dictionary and the values from slave. He can also change the values and has the possiblillty to export the object dictionary.
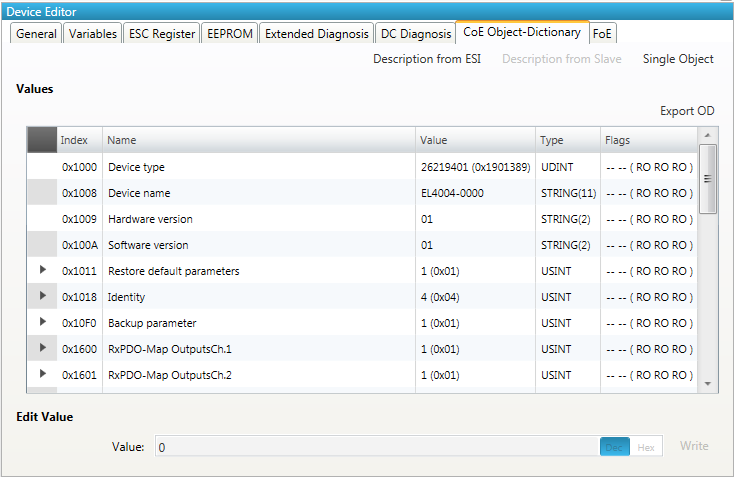
- Lists of CoE Object-Dictionary entries
Entries are uploaded from the slave (if “SDO Information Service” is supported)
- The “Flags” column tells the user if this entry is an PDO entry and if it can be edited
“AA BB C D (EE FF GG)” - AA = Mapping as RX PDO or not - BB = Mapping as TX PDO or not - C = Backup Flag - D = Settings Flag - EE = Access rights for PreOp (RO, WO, RW) - FF = Access rights for SafeOp (RO, WO, RW) - GG = Access rights for Op (RO, WO, RW)
- Buttons
- Write:
Writes the selected entry
- Single Object
In this tab, the user can read and write the values of the object dictionary of the slave.
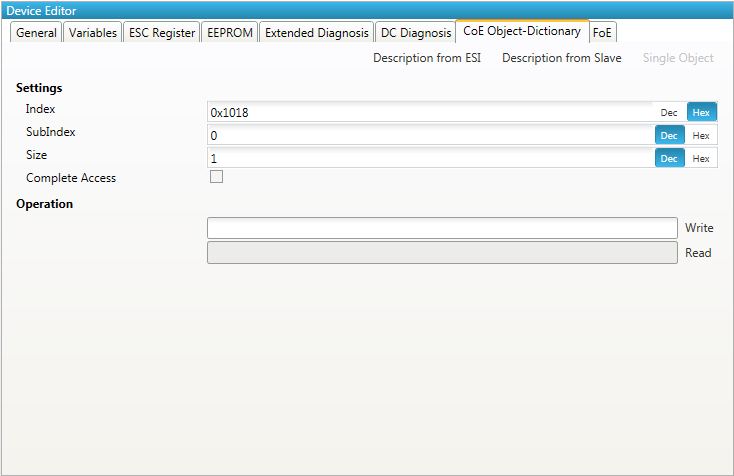
- Settings
- Index:
Index of the CoE value
- SubIndex:
SubIndex of the CoE value
- Size:
Size of the CoE value (only used for reading)
- Complete Access:
Activate, if complete access mode should be used for reading or writing the CoE value (can be used only if it is supported from slave)
- Operation
- Write:
Writes the value to the slave (Hex format, like: “00 11 22 33 …”)
- Read:
Reads the value from slave (Hex format, like: “00 11 22 33 …”)
6.3.8. SoE Object-Dictionary
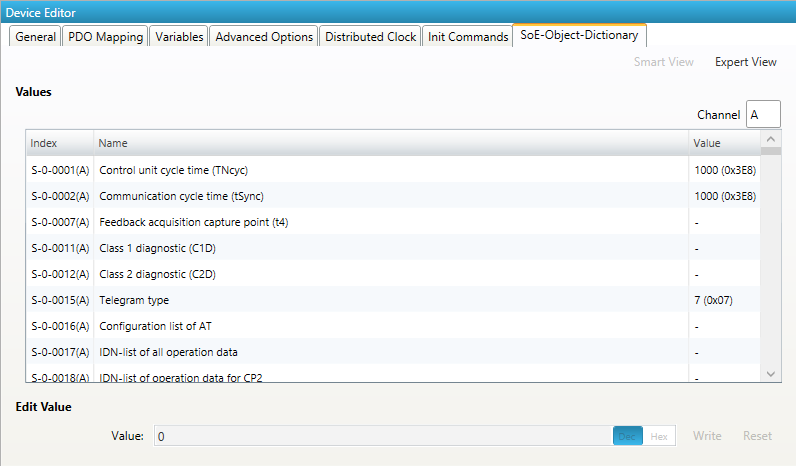
- Lists of SoE Object-Dictionary entries
Values are uploaded by the master from the slave
Entries comes from the
ESI
- Buttons
- Write:
Writes the selected entry
- Expert View
In this tab, the user can read and write the values of the object dictionary of the slave:
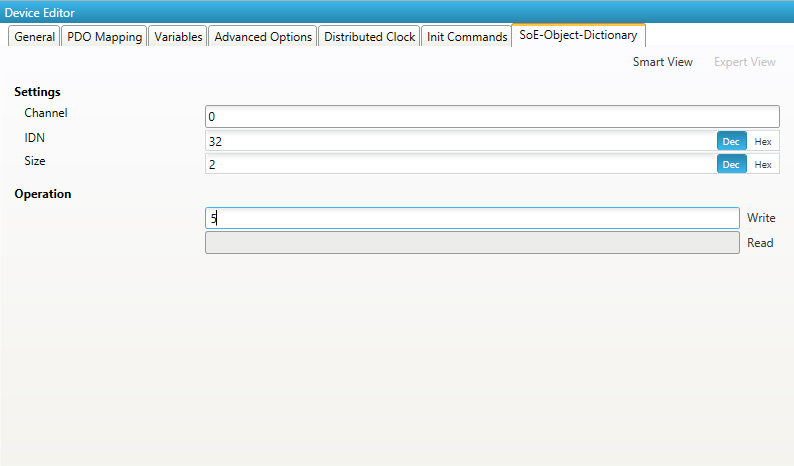
- Settings
- Channel:
Channel of the SoE value
- IDN:
Index of the CoE value
- Size:
Size of the CoE value (only used for reading)
- Operation
- Write:
Writes the value to the slave (Hex format, like: “00 11 22 33 …”)
- Read:
Reads the value from slave (Hex format, like: “00 11 22 33 …”)
6.3.9. File over Ethernet (FoE)
- In this tab, the user has the possibility to download or upload a file to the slave:
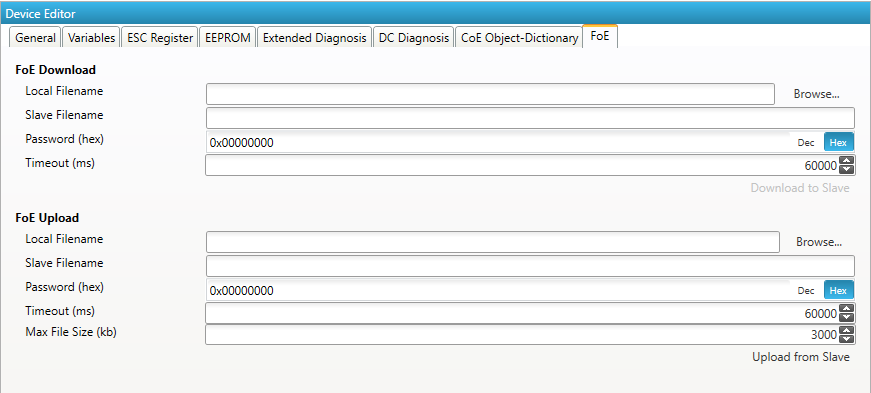
- FoE Operations
- Local Filename:
Name of the file on the harddrive
- Slave Filename:
Name of the file on the slave
- Password:
Password on the slave as a hex-number
- Timeout:
Timeout for downloading or uploading the file in milliseconds
- Max File Size:
Maximal file size which should be uploaded from the slave in kilo bytes
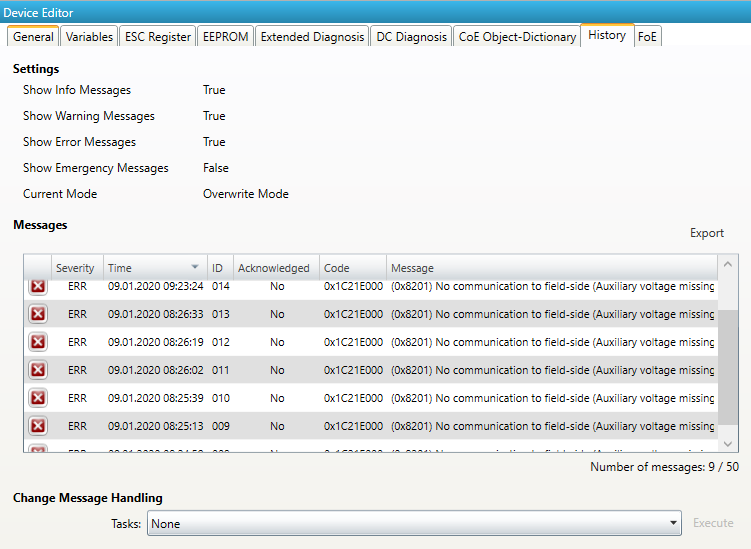
6.3.10. Slave History (Expert)
- In this tab, the user can see and change the diagnosis history of the slave. It is also possible to export the data:
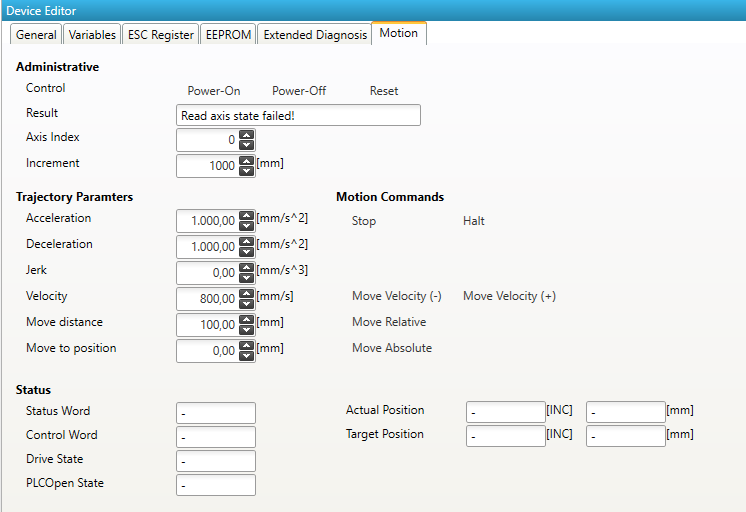
6.3.11. Motion (Motion Mode only)
- In this tab, the user can see and change the motion settings of the slave. He can read important variables and change velocity and direction of the axis:
6.3.12. Simulator (Simulator only)
- In this tab, the user can see and change the simulator settings of the slave. He can manipulate the slave e.g. power, disconnect and produce errors:
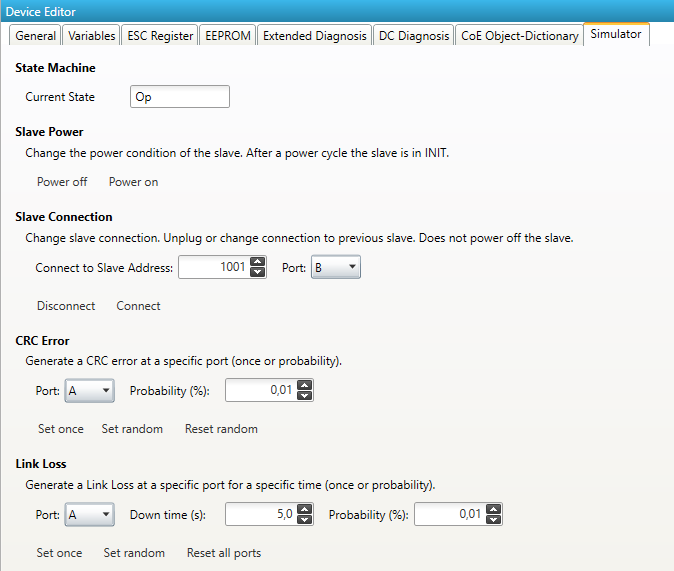
- State Machine
Shows the current state of the slave
- Slave Power
- Power off:
Turn the slave power off
- Power on:
Turn the slave on to Init state
- Slave Connection
- Disconnect:
Disconnect the slave. Slave will not be turned off
- Connect:
Connect slave to selected address and port. Default is the port where the slave was connected before
- CRC Error
- Set once:
Create one CRC error at the selected port
- Set random:
Generate CRC errors at the selected port with the selected probability until reset is executed
- Reset random:
Reset the CRC generation
- Link Loss
- Set once:
Create one Link Loss at the selected port for the selected time
- Set random:
Generate Link Losses at the selected port with the selected probability for the selected time until reset is executed
- Reset random:
Reset the Link Loss on all ports