5. Diagnosis
5.1. Overview
EC-Inspector is a diagnosis application specifically developed to analyze EtherCAT networks that are controlled by an EtherCAT MainDevice. Automated control systems usually require high availability of the whole system. Due to the rough industrial environment this is often hardly to achieve.
If high availability shall be guaranteed for an automated control system it is important to verify and maintain the field bus. Using EC-Inspector it is possible to take a look into the “health” of the EtherCAT system. Detection of signs of system degradation prior to running into a system failure will be of great benefit. In that case it is possible to exchange the problematic components (cables, SubDevice devices).
- Many aspects of diagnosis are covered by the EC-Inspector:
System analysis and maintenance
Error detection
Documentation
After switching into diagnosis mode of EC-Inspector, the user will see this page:

5.2. Device
This section shows the current “health” state of the MainDevice and helps the user to analyze MainDevice related problems.
5.2.1. General
In this tab, the user can see the current state of the state machine of the MainDevice. He has also an overview over the current “health” state of his EtherCAT network:
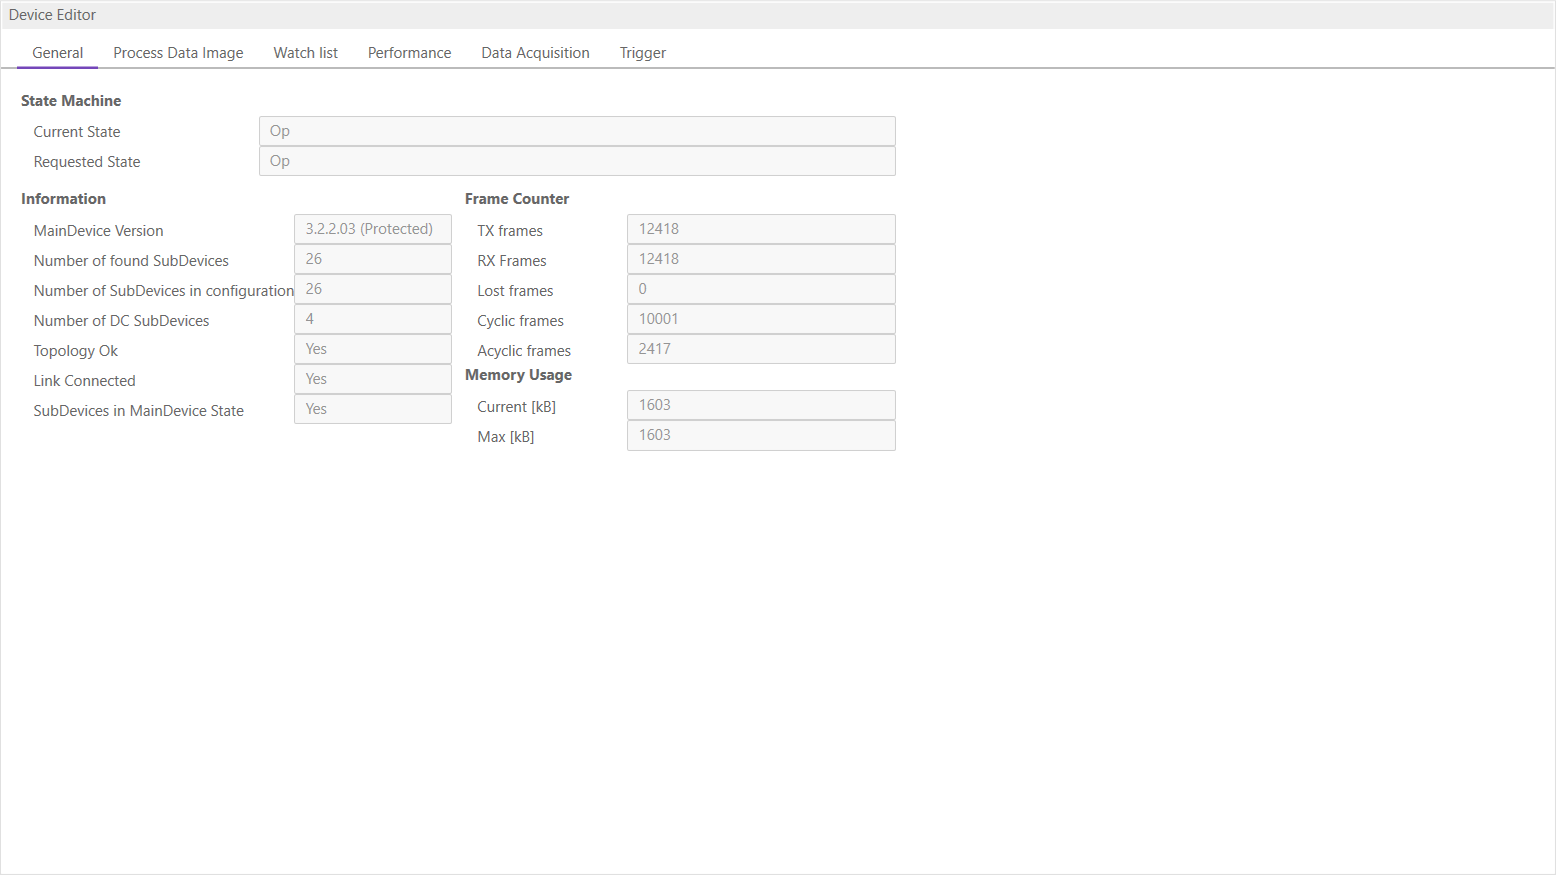
- State Machine
- Current State:
Current state of the MainDevice
- Requested State:
Requested state of the MainDevice
- Information
- Device version:
Version number of the running MainDevice
- Number of found SubDevices:
Number of SubDevices, which were found from device on the network
- Number of SubDevices in configuration:
Number of SubDevices, which are configured in the
ENIfile- Number of DC SubDevices:
Number of SubDevices with DC support, which were found from MainDevice on the network
- DC in-sync:
Signals that all SubDevices with DC support are correctly synchronized or not. If not all SubDevices are correctly synchronized, please refer the Message Window for more information.
- Topology OK:
Signals that topology is “okay” or not. If topology is not “okay”, you have a mismatch between the configured bus and the currently connected bus. Please open the ‘Network Mismatch Analyzer’ (Menu Network Network Mismatch Analyzer) to solve the problem.
- Link Connected:
Signals the link is connected.
- SubDevices in MainDevice State:
Signals that all SubDevices are in MainDevice state.
- Frame Counter
- TX frames:
Number of sent frames
- RX frames:
Number of received frames
- Lost frames:
Number of lost frames
- Cyclic frames:
Number of cyclic frames
- Acyclic frames:
Number of acyclic frames
- Memory Usage
- Current:
Current memory usage in bytes
- Max:
Maximum memory usage in bytes
5.2.2. Process Data Image
In this tab, the user can see and change the values of the process variables. The variables will be forced to the value the user entered. The user can press release to release the variable. If one or two variables are selected, a chart of the values is shown. Also resize and zoom is possible to see more details. The chart will be updated every 250 milliseconds:
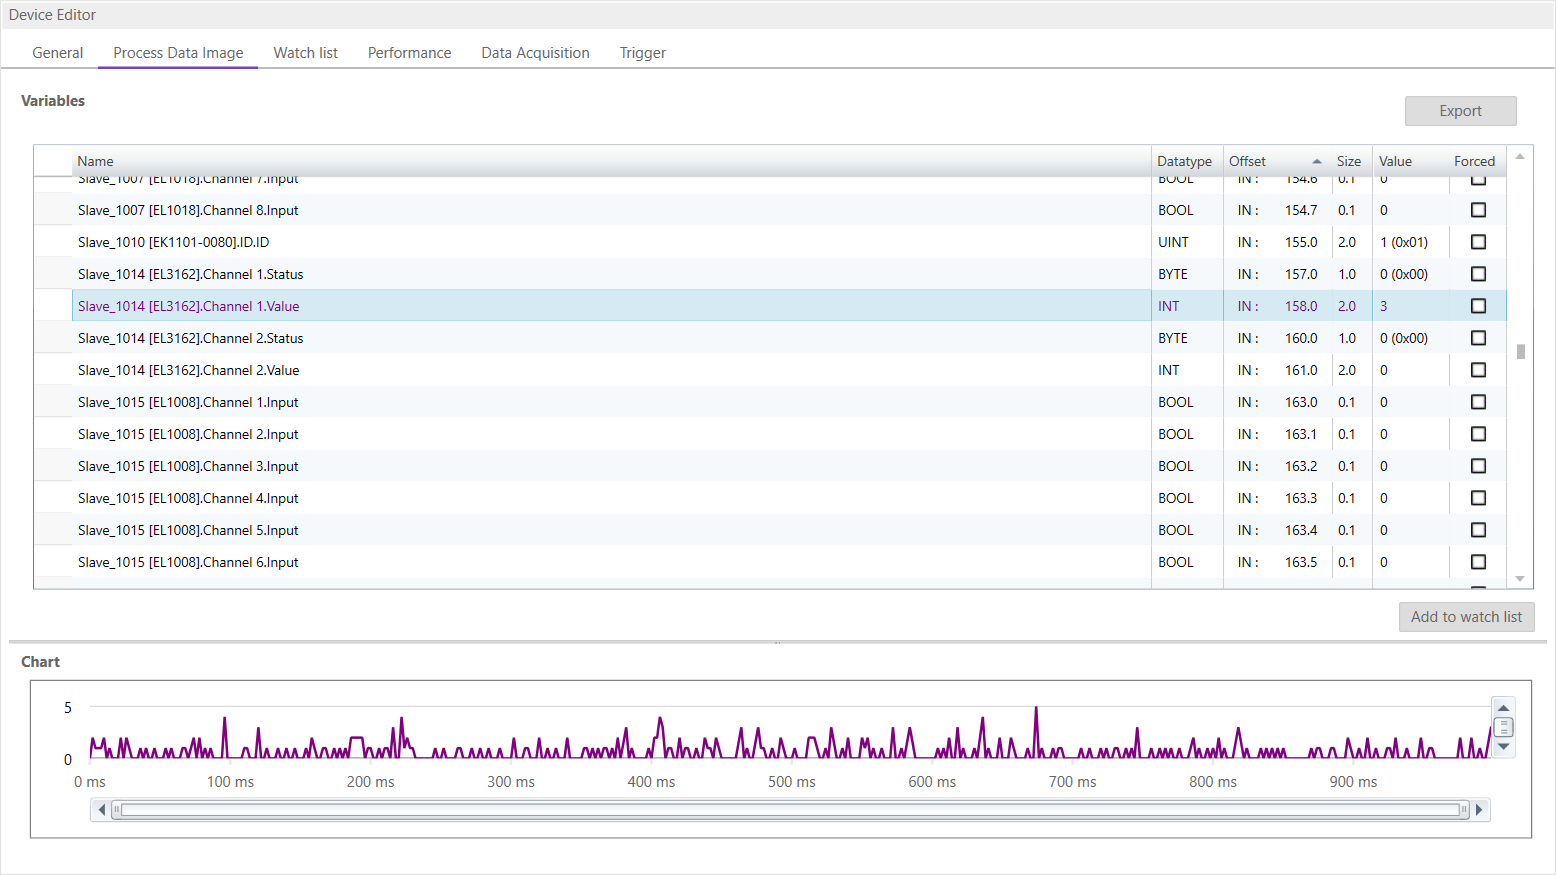
It is also possible to add the variables to a watch list (next chapter).
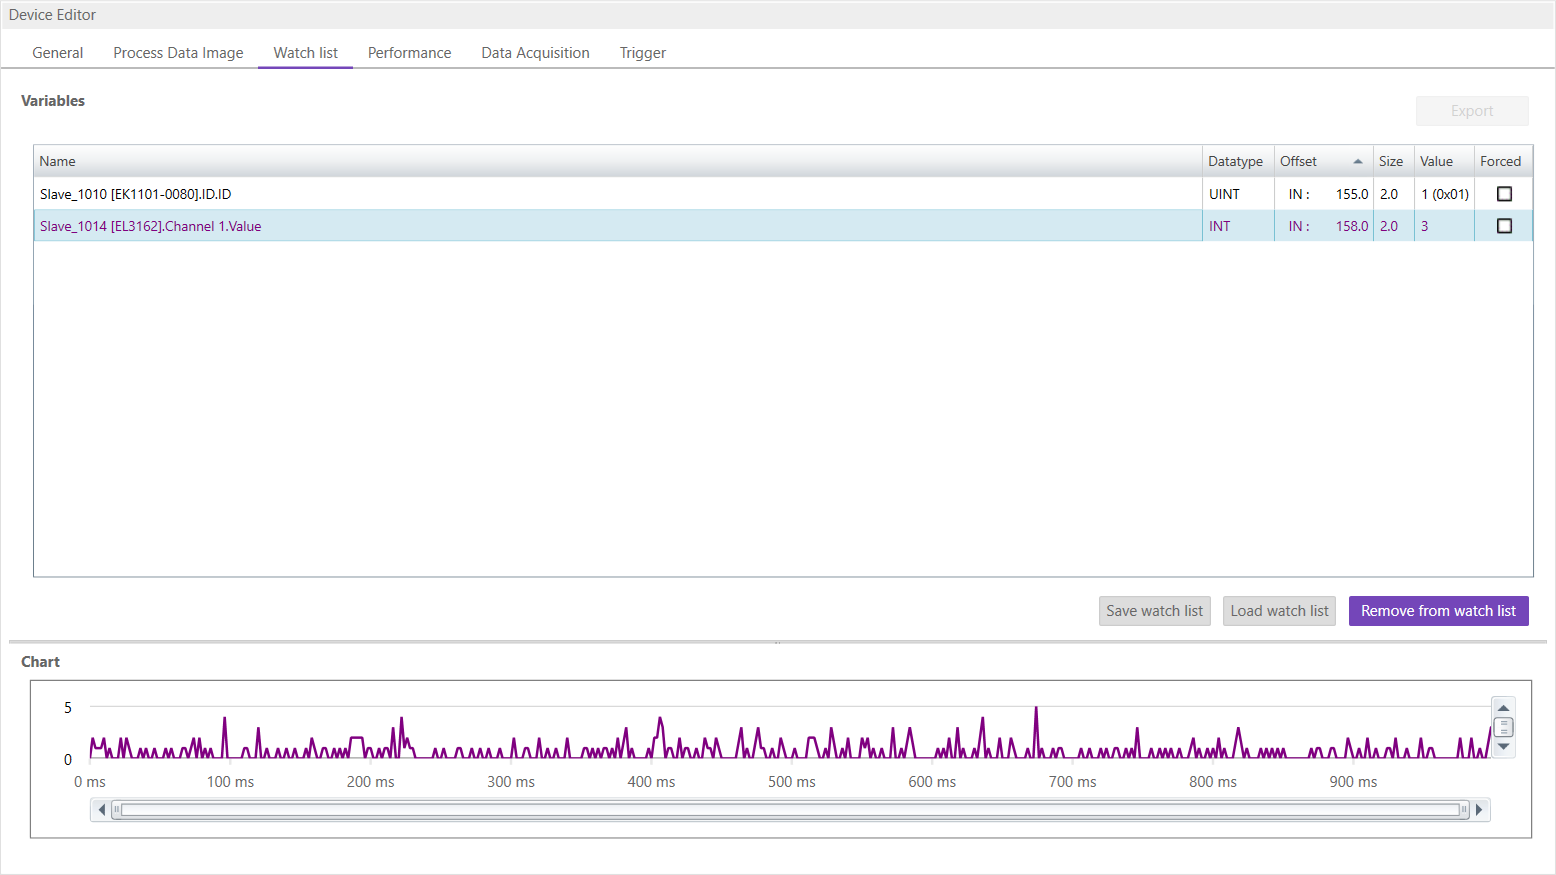
5.2.3. Watch list
In this tab, the user can monitor selected variables. He can go through the SubDevices and add variables to the watch list to monitor them. The user can also export or import the watch list, so changes can be saved:
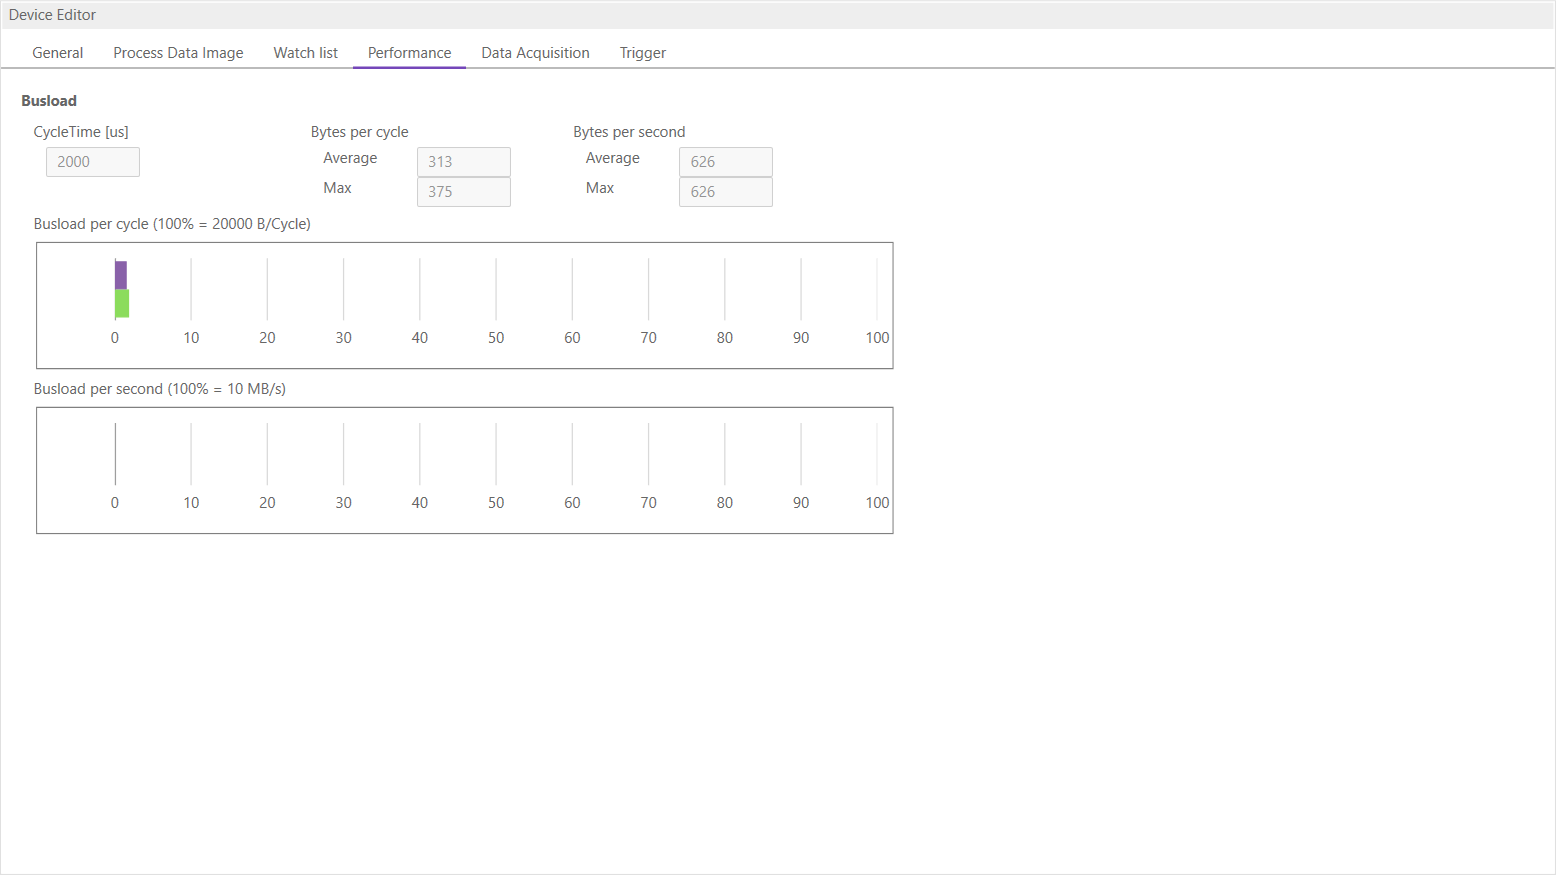
5.2.4. Performance
- In this tab, the user can see the busload per cycle and per second:
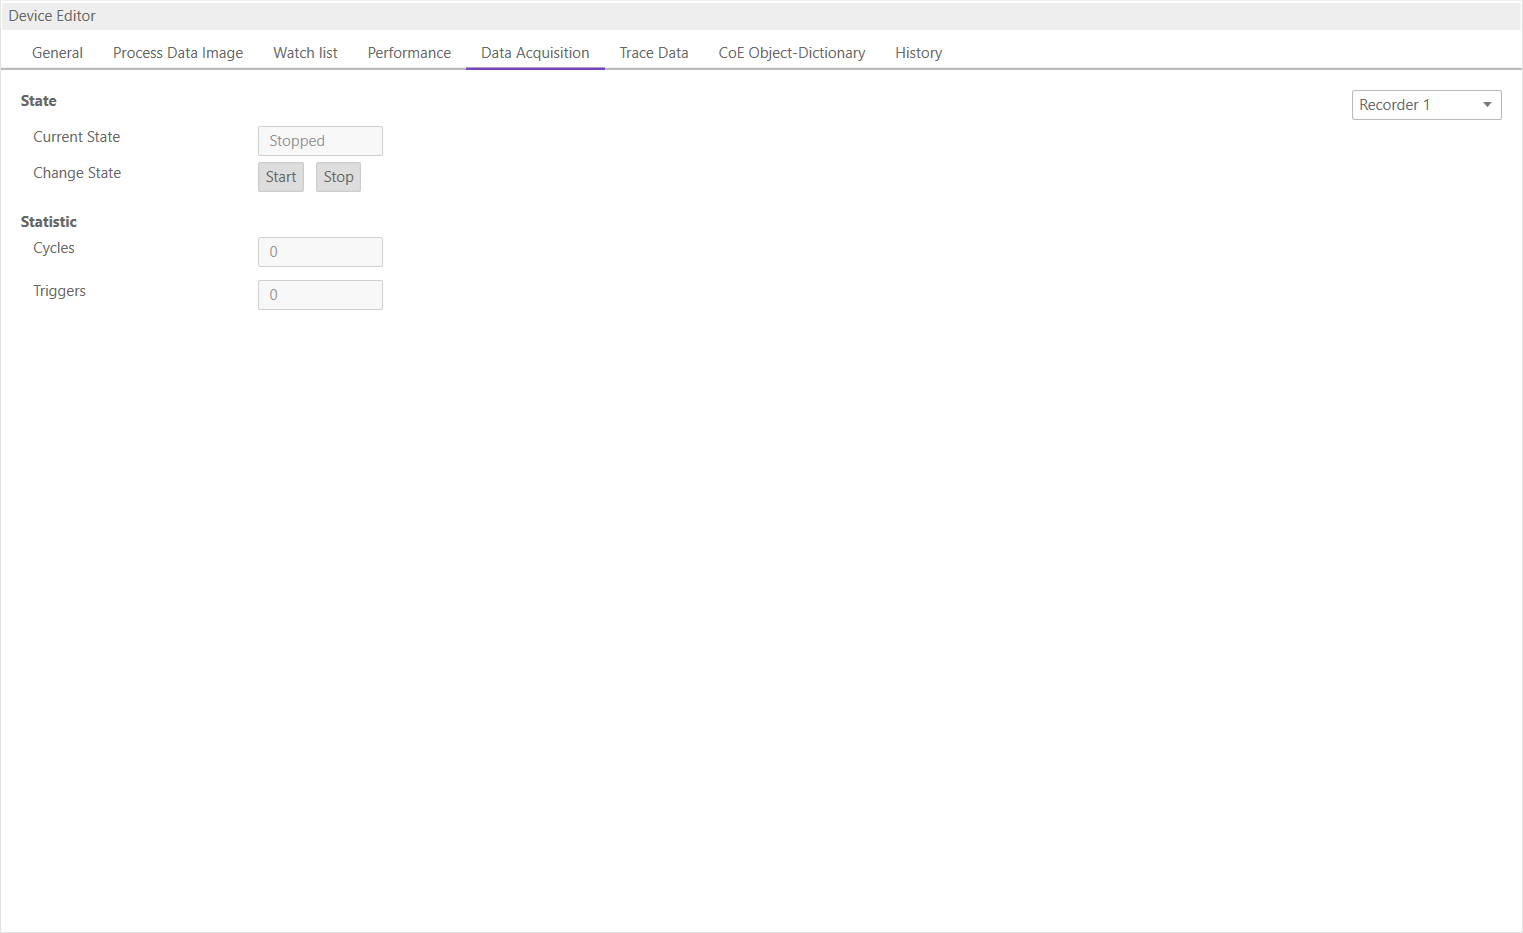
5.2.5. Data Acquisition Diagnosis
- In this tab, the user can start and stop the DAQ recorders. Also he can see some statistics of running recorders.
5.3. SubDevice
This section shows the current “health” state of the selected SubDevice and helps the user to analyze SubDevice related problems.
5.3.1. General (SubDevice)
In this tab, the user can see the current state of the state machine of the SubDevice:
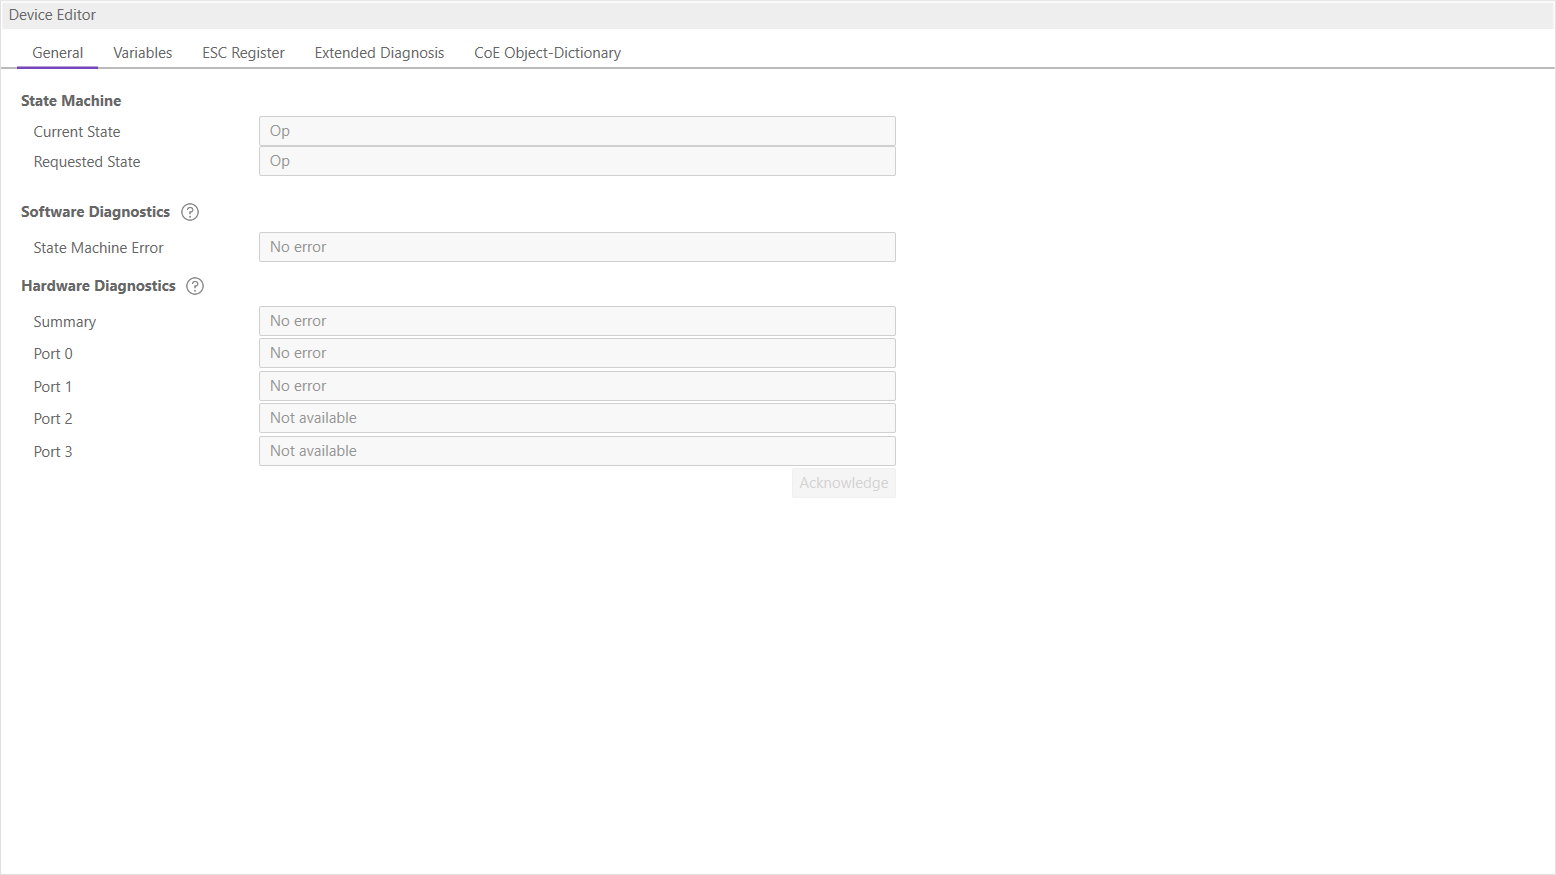
- State Machine
- Current State:
Current state of the selected SubDevice
- Requested State:
Requested state of the selected SubDevice
- Software Diagnostics
- State Machine Error:
SubDevice error which occurred during state transition
- Hardware Diagnostics
- Summary:
Summary of hardware diagnostics
- Port A:
Port specific error
- Port D:
Port specific error
- Port B:
Port specific error
- Port C:
Port specific error
- Buttons
- Acknowledge:
Acknowledge the current error state and notify the user again if error state was changed again.
- Possible warning and errors:
- Disturbed Connection:
There may be problems in the connection between two SubDevices. The message will tell either that there is a problem between two SubDevices or two ports. The warning appears if error counters are increased (Invalid Frame: 0x300-0x306, RX Errors: 0x301-0x307, Lost Link: 0x308-0x30B). The value from which a warning is issued can be set in the User.xml files in C:/ProgramData/EC-Engineer. More information below.
- Bad Connection:
The same as “Disturbed Connection” but the error counters are higher. The value from which an error is issued can be set in the User.xml files in C:/ProgramData/EC-Engineer. More information below.
- Line break:
A line break is detected before a SubDevice. This error is detected by looking at the topology.
- Link missing:
A link is missing on input port of the SubDevice. This error is detected by looking at the topology.
- Multiple warnings:
There are multiple warning for this port.
- Multiple errors:
There are multiple errors for this port.
- Multiple warnings and errors:
There are multiple warning and errors for this port.
- State Machine:
See ETG1020 “Description of AL Status Codes” or ETG.1000.6. This error is detected by looking at the AL Status (0x130).
- How to solve errors?
Lost Link errors are often caused by the power supply system
Helpful might be the usage of an extra power supply
It is recommended to clear all error counters after startup
- How to change amount of errors leading to a warning or error:
Open C:/ProgramData/EC-Inspector
Search for DiagGeneral
- Change the values which should be adjusted
LostLink: The value entered is used
All others are calculated depending on the amount of cyclic frames: (Value / CyclicFrames) x 10^6
Note
Please refer also the “ETG.1600 EtherCAT Installation Guideline”: http://www.ethercat.org/ETG1600.
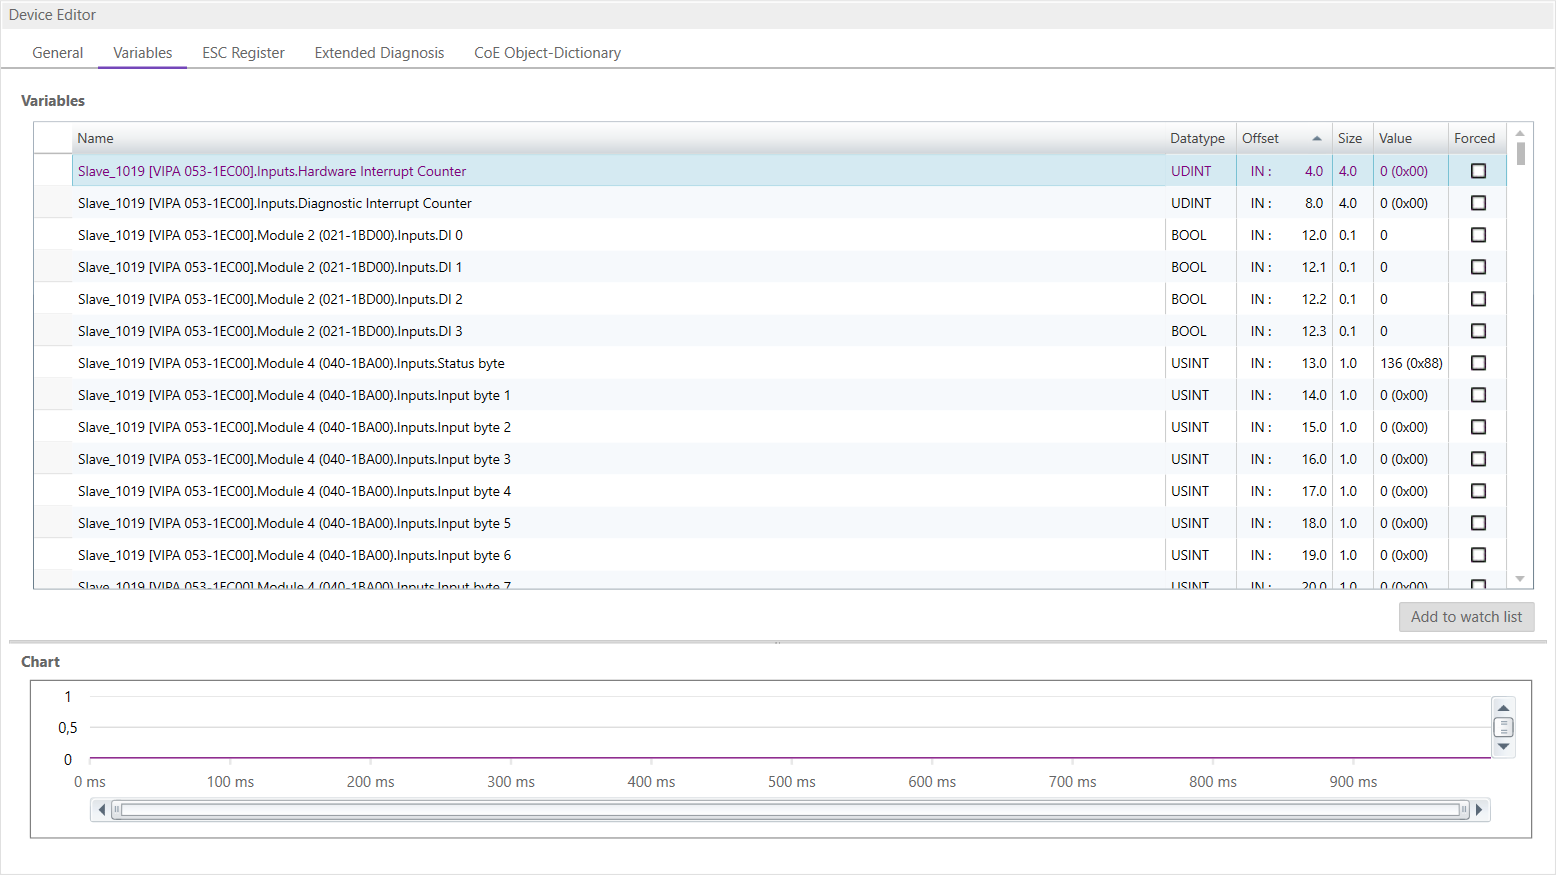
5.3.2. Variables
In this tab, the user can see and change the values of the process variables. The variables will be forced to the value the user entered. The user can press release to release the variable. If one or two variables are selected, a chart of the values is shown. Also resize and zoom is possible to see more details. The chart will be updated every 250 milliseconds:
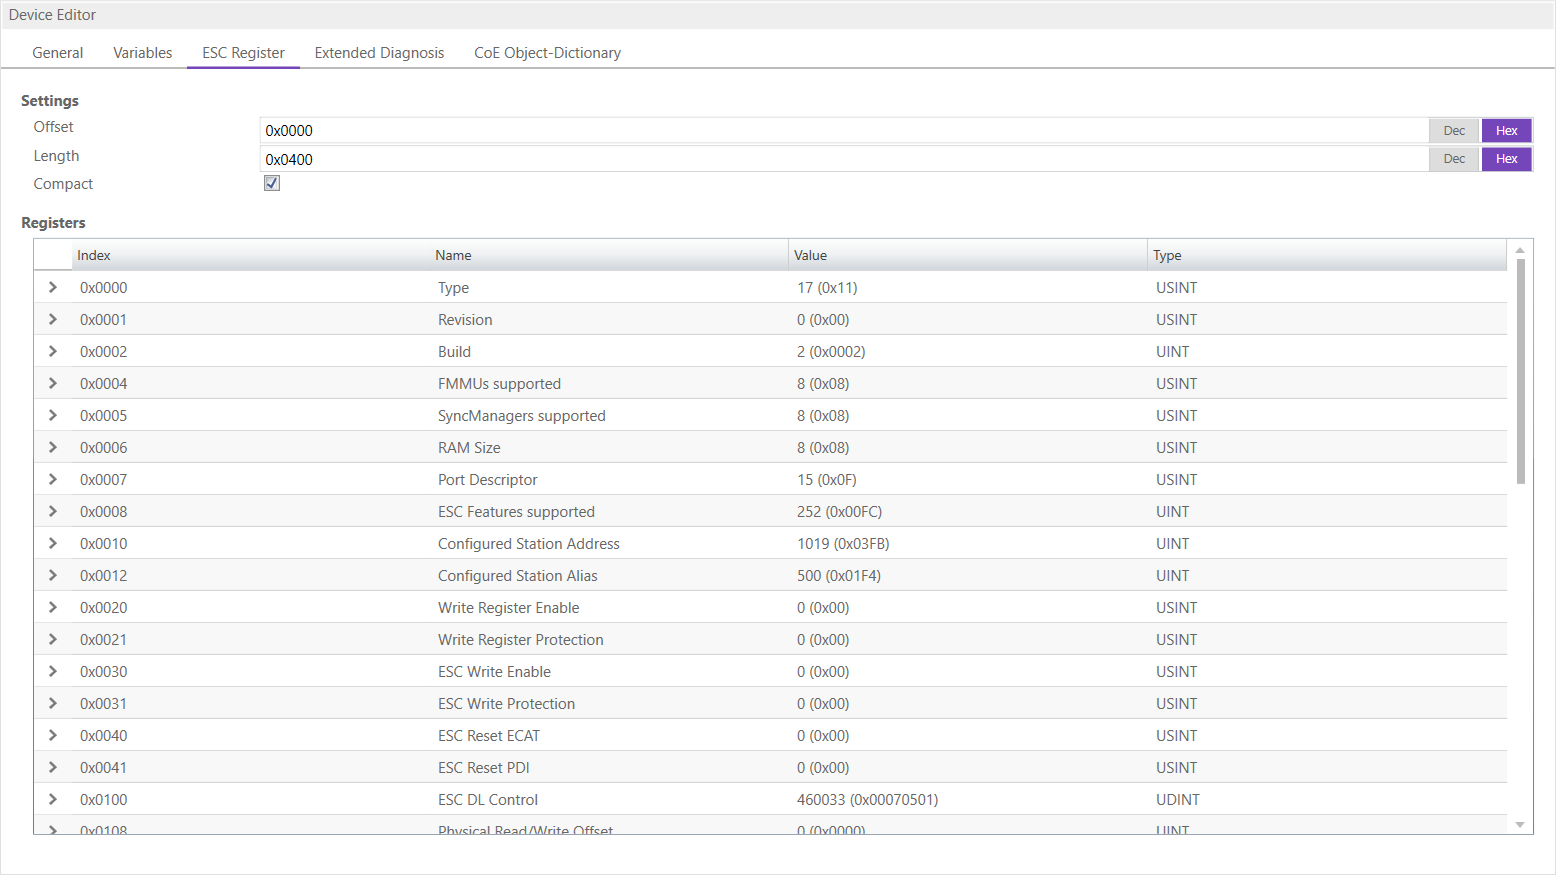
5.3.3. ESC Register
In this tab, the user can see the values of the registers. In the settings section he can set the offset and the length. If he activates the compact view, he will only see the registers which have a description:
5.3.4. Extended Diagnosis
In this tab, the user can see the extended diagnosis information:
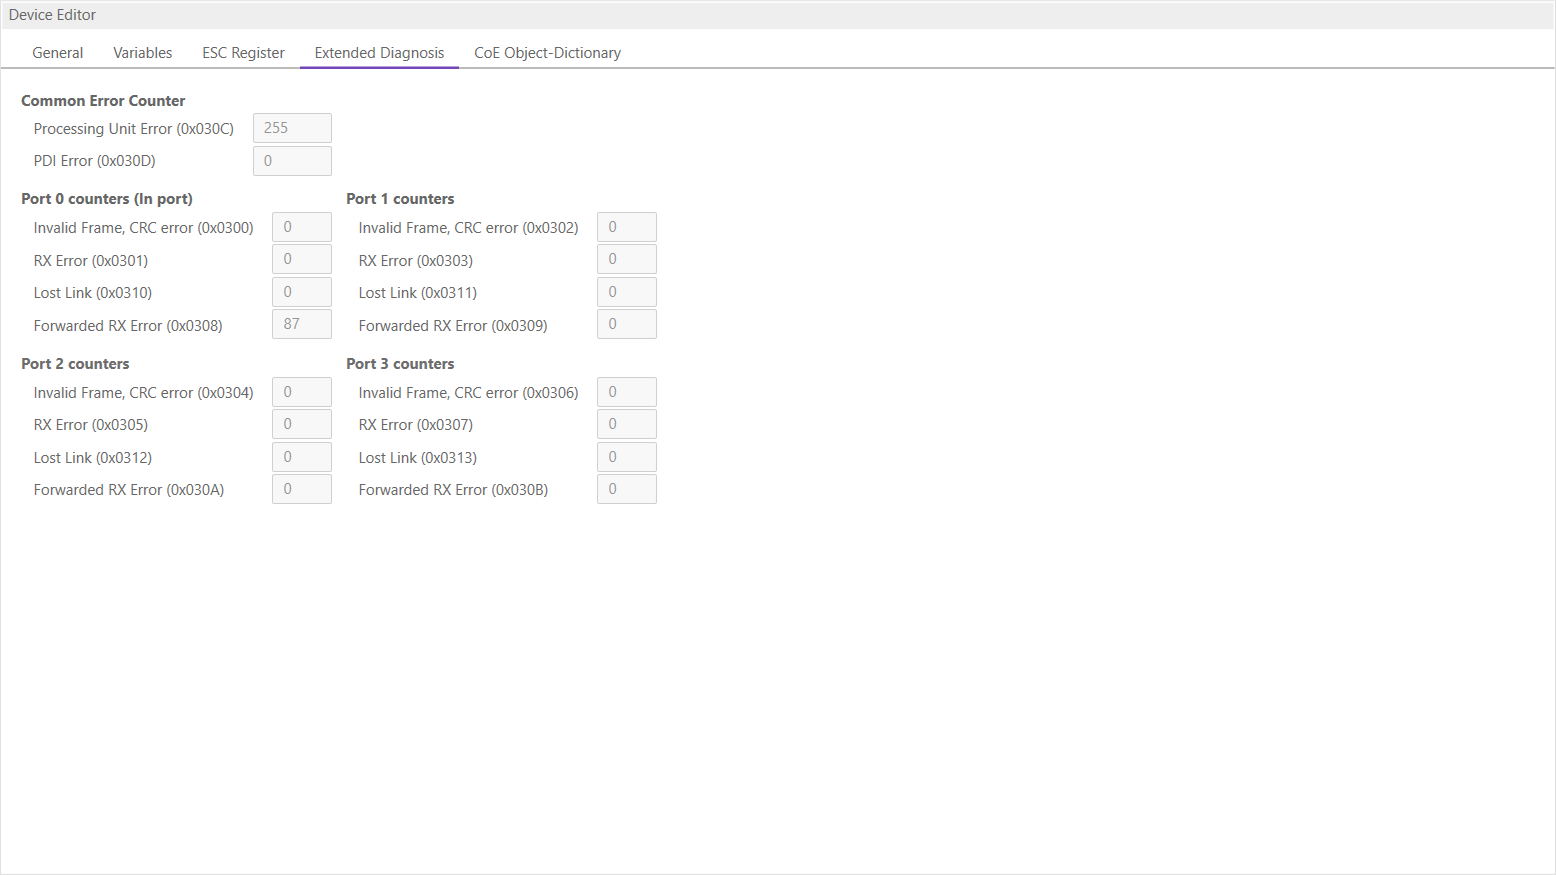
There will be a red ! to signalize that a counter is higher than 0. Except for the forwarded errors.
If an error counter is ‘-’ it was not read. If it is ‘0’ it is really zero. So there is a difference between ‘0’ and ‘-‘.
- Common Error Counter
- Processing Error Counter:
Indicates that SubDevice received “not EtherCAT frames”, which are not allowed in the EtherCAT segment (of course acceptable in a test environment)
- PDI Error Counter:
Counts if a PDI access has an interface error (read from register: 0x30D)
- Port 0..3
Invalid Frame Counter of Port y (read from register: 0x0300+y*2)
RX Error Counter of Port y (read from register: 0x0300+y*2+8Bit)
Lost Link Counter of Port y (read from register: 0x0310+y)
Forwarded RX Error Counter of Port y (read from register: 0x0308+y)
- Acknowledge warning
If one of the error counters increase there will be a warning in the tree, sigalized with an icon. With this button it is possible to acknowledge this warning. So the SubDevice can be monitored again and the icon will come back with the next error.
To see this information the error counters must be read by the EtherCAT MainDevice. Only if this is activated the EC-Inspector is able to read this. Here is a quick overview on how to activate this function on different MainDevices:
- acontis EC-Master:
To activate the error collection of the acontis EC-Master, the follwing API has to be called:
/* SubDevice statistics polling for error diagnostic */
EC_T_DWORD dwPeriodMs = 1000;
dwRes = ecatIoCtl(EC_IOCTL_SET_SLVSTAT_PERIOD, (EC_T_BYTE*)&dwPeriodMs, sizeof(EC_T_DWORD), EC_NULL, 0, EC_NULL);
if (dwRes != EC_E_NOERROR)
{
    EcLogMsg(EC_LOG_LEVEL_ERROR, (pEcLogContext, EC_LOG_LEVEL_ERROR, "ecatIoControl(EC_IOCTL_SET_SLVSTAT_PERIOD) returns with error=0x%x\n", dwRes));
    goto Exit;
}
- Third Party MainDevice:
Find more details here Operating with Third Party EtherCAT Controller
5.3.5. CoE Object-Dictionary
This tab consists of different modes:
- Description from
ESI In this tab, the user can see the description of the object dictionary from
ESIand the values from the SubDevice.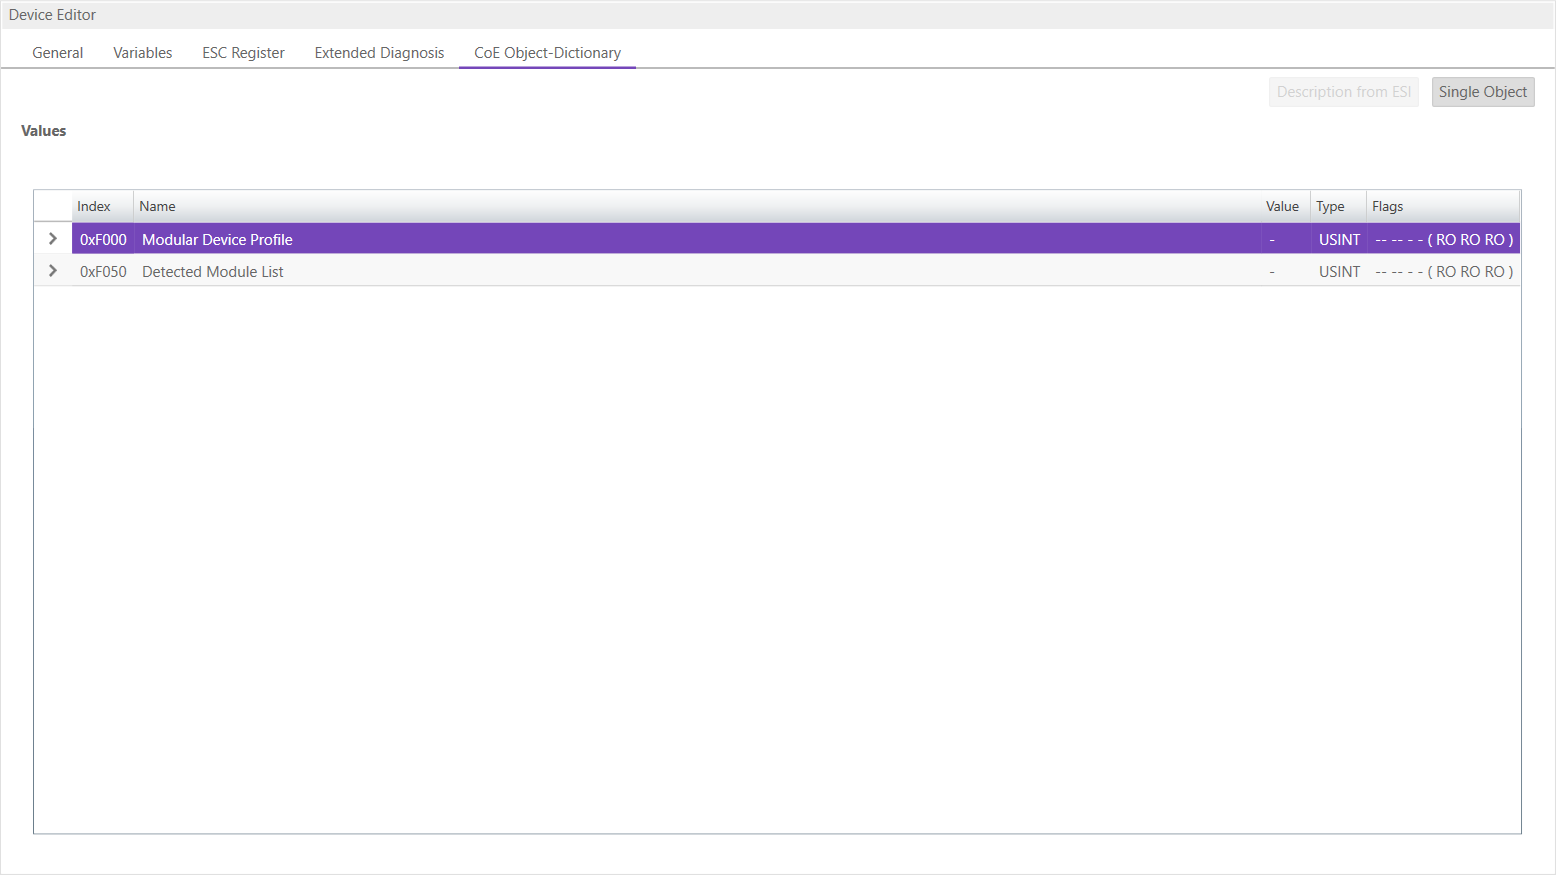
- Lists of CoE Object-Dictionary entries
Entries comes from
ESI- The “Flags” column tells the user if this entry is an PDO entry and if it can be edited
“AA BB C D (EE FF GG)”
AA = Mapping as RX PDO or not
BB = Mapping as TX PDO or not
C = Backup Flag
D = Settings Flag
EE = Access rights for PreOp (RO, WO, RW)
FF = Access rights for SafeOp (RO, WO, RW)
GG = Access rights for Op (RO, WO, RW)
- Single Object
In this tab, the user can read and write (not EC-Inspector) the values of the object dictionary of the SubDevice.
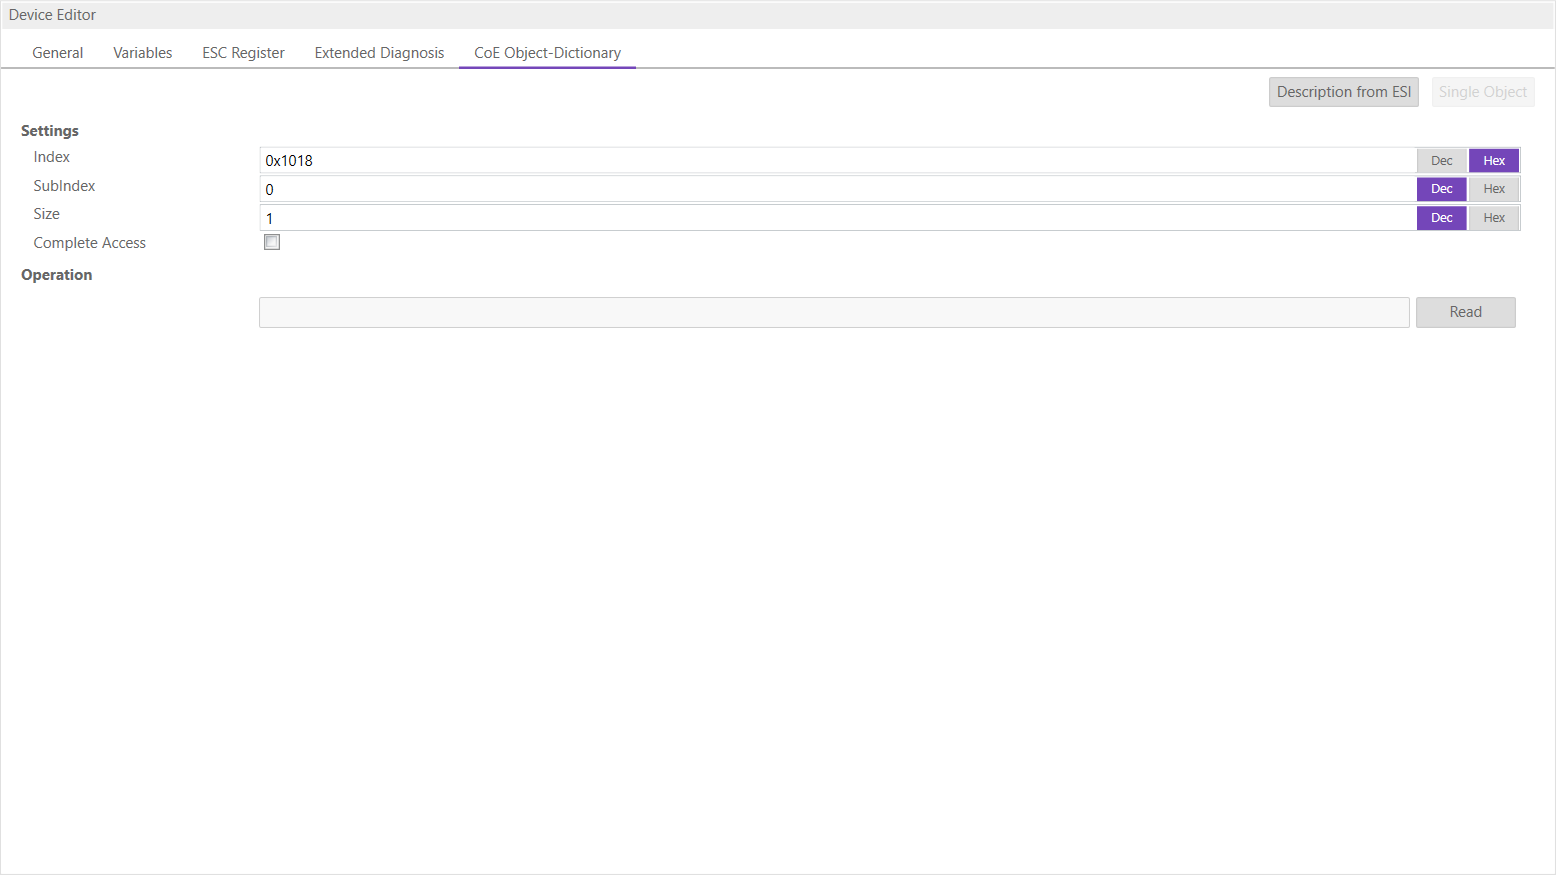
- Settings
- Index:
Index of the CoE value
- SubIndex:
SubIndex of the CoE value
- Size:
Size of the CoE value (only used for reading)
- Complete Access:
Activate, if complete access mode should be used for reading or writing the CoE value (can be used only if it is supported from SubDevice)
- Operation
- Read:
Reads the value from SubDevice (Hex format, like: “00 11 22 33 …”)
5.3.6. File over Ethernet (FoE)
- In this tab, the user has the possibility to download or upload a file to the SubDevice:
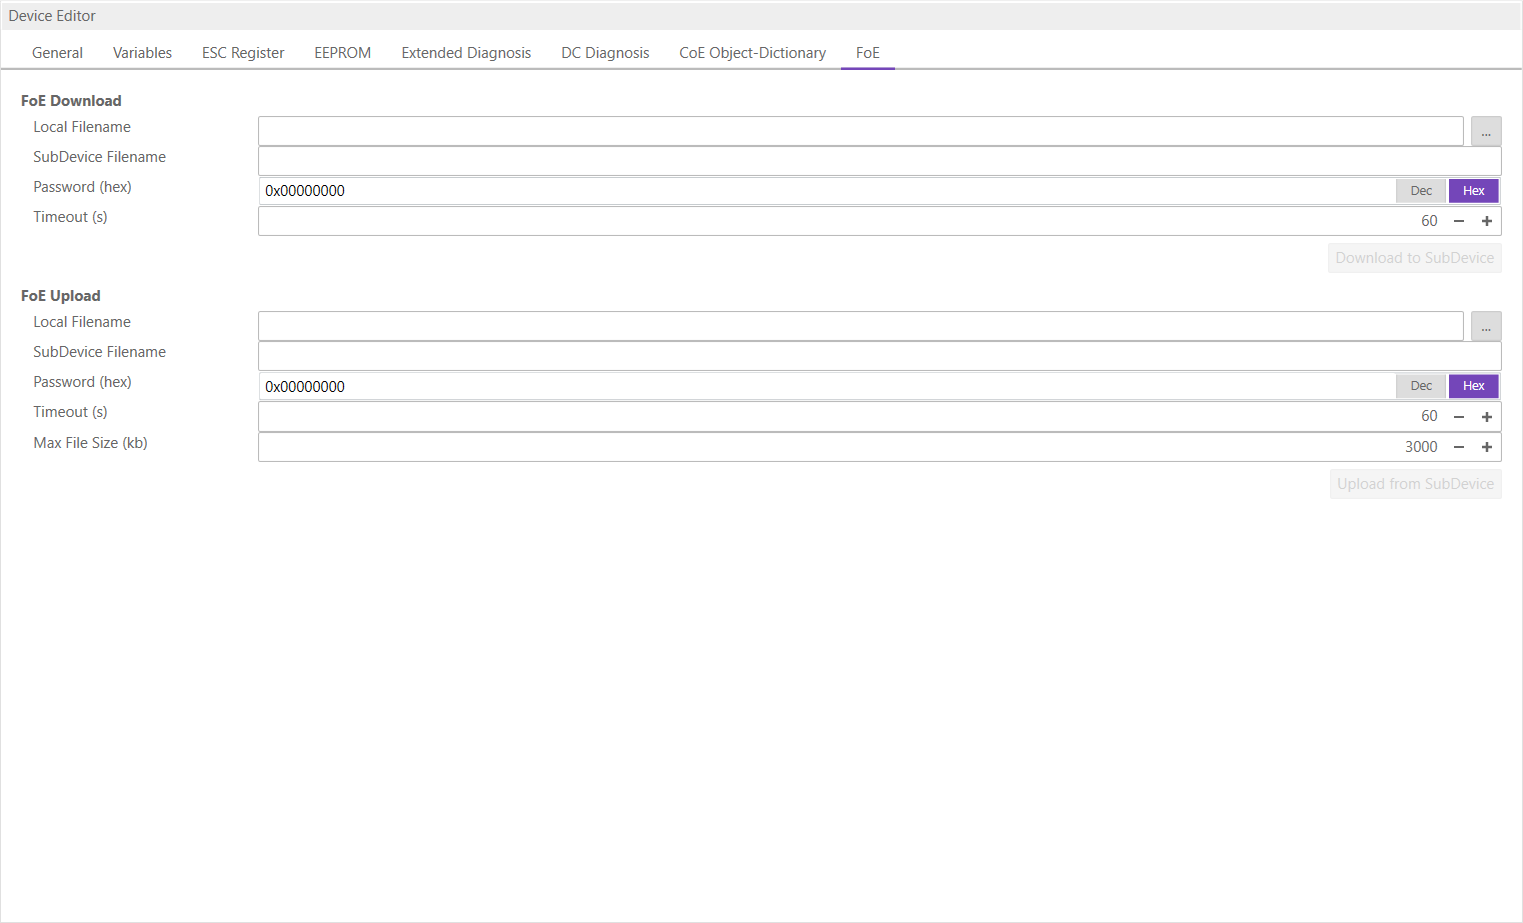
- FoE Operations
- Local Filename:
Name of the file on the harddrive
- SubDevice Filename:
Name of the file on the SubDevice
- Password:
Password on the SubDevice as a hex-number
- Timeout:
Timeout for downloading or uploading the file in milliseconds
- Max File Size:
Maximal file size which should be uploaded from the SubDevice in kilo bytes
5.3.7. History (SubDevice)
- In this tab, the user can see and change the diagnosis history of the SubDevice. It is also possible to export the data:
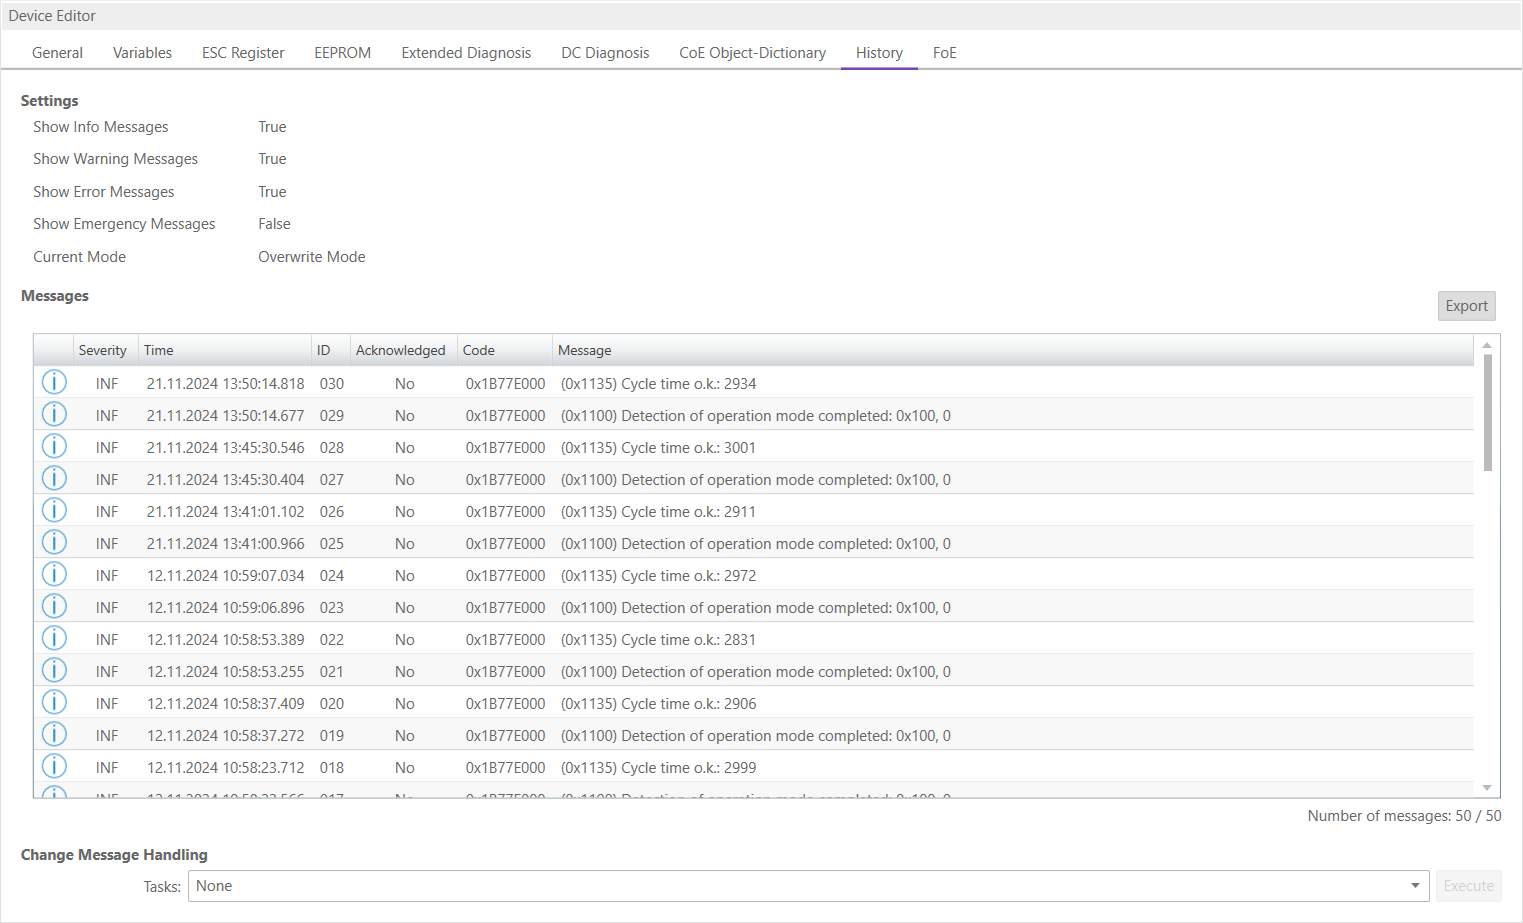
- Settings
- Show Info Messages:
Info messages will be collected from SubDevice
- Show Warning Messages:
Warning messages will be collected from SubDevice
- Show Error Messages:
Error messages will be collected from SubDevice
- Show Emergency Messages:
Emergency messages will be collected from SubDevice
- Current Mode:
Overwrite Mode: Messages will be overwritten if buffer is full Acknowledge Mode: Messages will be discarded if buffer is full
- Messages
List of history messages
- Change Message Handling
- Enable/Disable Info Messages:
Enable or disable info messages
- Enable/Disable Warning Messages:
Enable or disable warning messages
- Enable/Disable Info Messages:
Enable or disable info messages
- Enable/Disable Error Messages:
Enable or disable error messages
- Enable/Disable Emergency Messages:
Enable or disable emergency messages
- Enable Acknowledge Mode:
Enable acknowledge mode
- Enable Overwrite Mode:
Enable overwrite mode
- Clear All Messages:
Clear all messages (only available if “Overwrite Mode” is active)
- Clear All Acknowledged Messages:
Clear all acknowledged messages (only available if “Acknowledge Mode” is active)
- Acknowledge All Messages:
Acknowledge all messages, that they can be overwritten from new messages (only available if “Acknowledge Mode” is active)
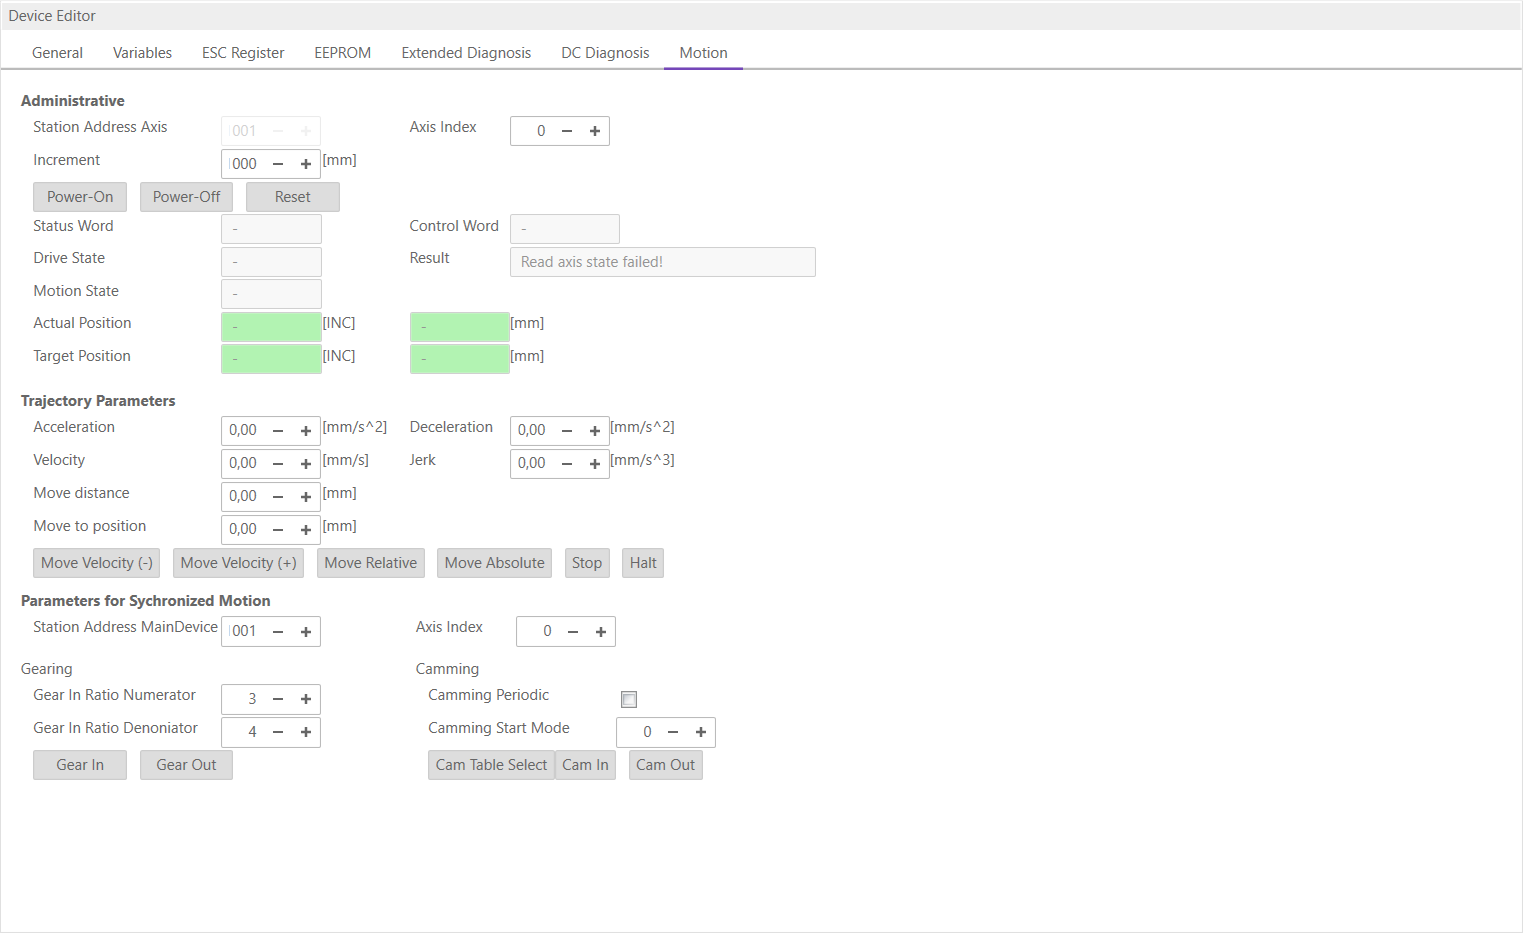
5.3.8. Motion (Motion Tabs only)
- In this tab, the user can see and change the motion settings of the SubDevice. He can read important variables and change velocity and direction of the axis. Also gearing and camming are possible to use: