7. Additional Tools
7.1. ESI-Manager
ESI-Manager can be found through the main menu File -> ESI-Manager.
- This dialog helps the user to administrate his
ESIandSCIfiles. Here, he can add/delete/exportESIandSCIfiles. 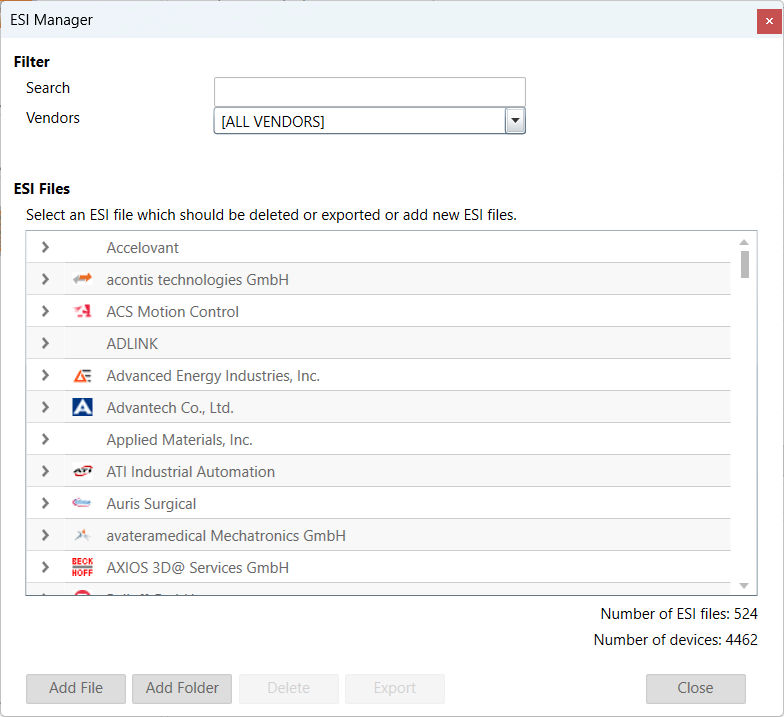
7.2. Inspection Report
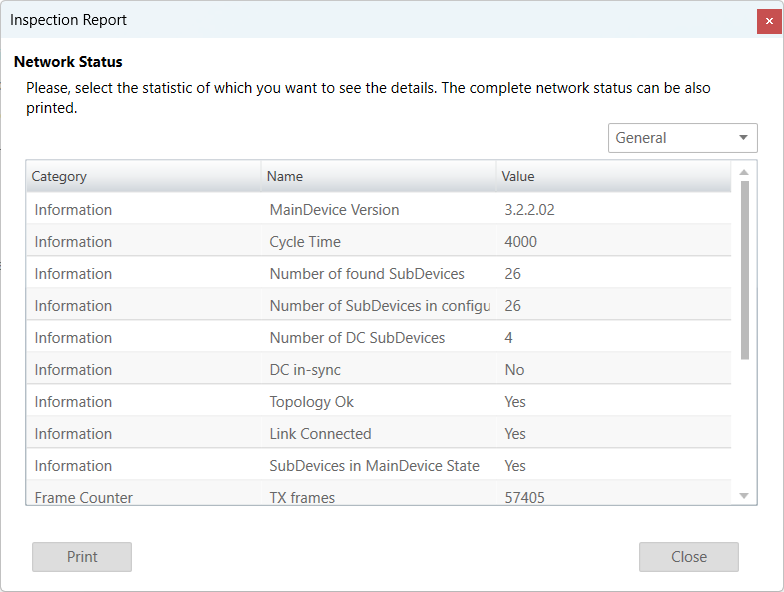
- If you want to print or show a report about the actual session, it is possible with the inspection report. I shows a lot of different data about the network communication. It is also possible to print a PDF.
7.3. Settings
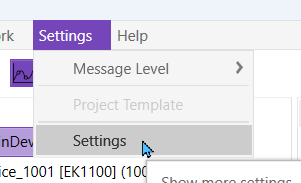
Can be found inside the settings menu bar.
7.3.1. General
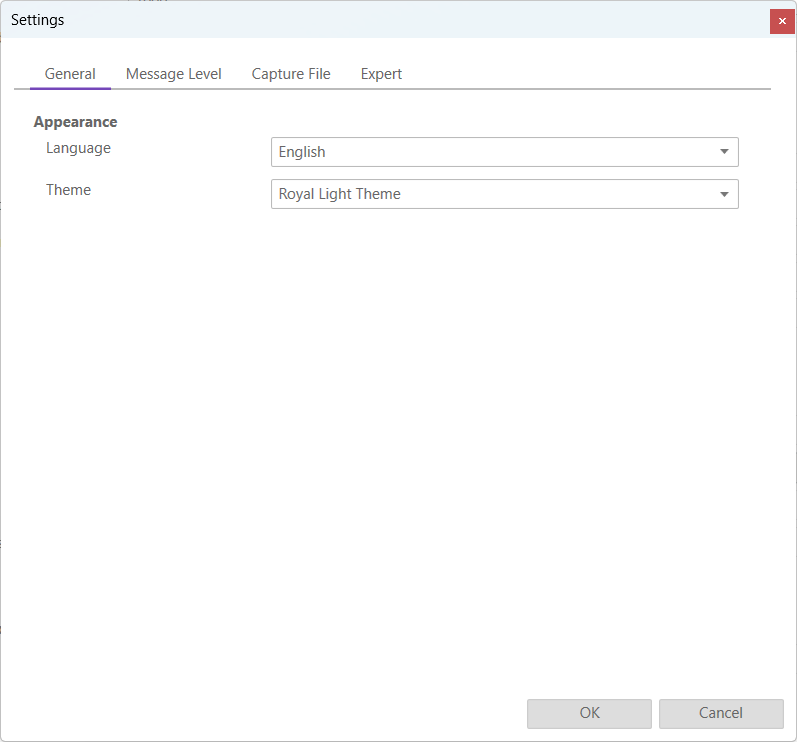
- Appearance
- Language:
Changes the current language
- Theme:
Changes the current theme
7.3.2. Message Level
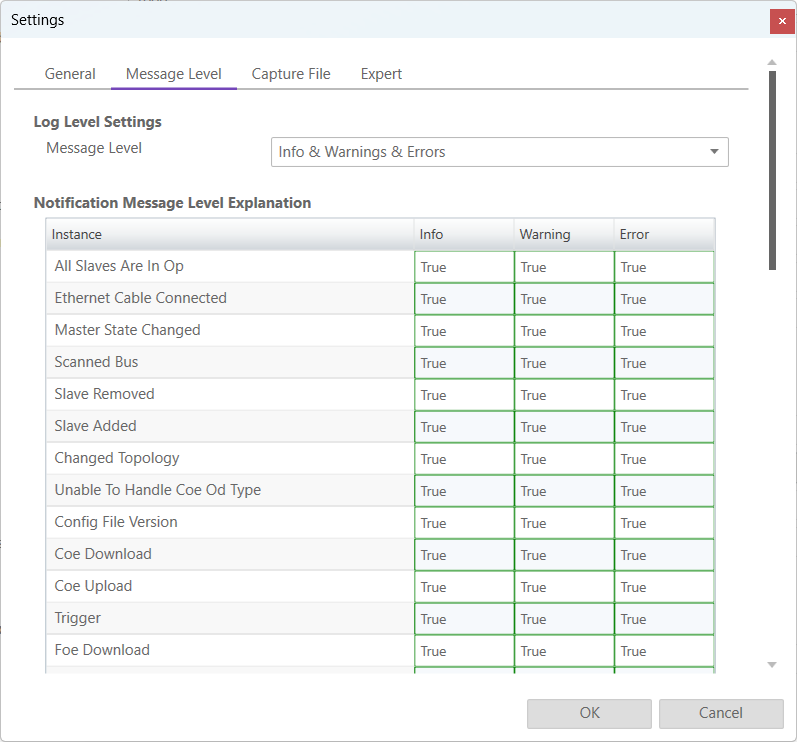
In this tab the log level of the message panel can be changed.
- Log Level Settings
- Message Level:
Changes what messages are displayed on the message panel
- Explanation
We can see what messages are displayed depending on the selected message level (true it is displayed, false it is not displayed)
7.3.3. Capture File
A capture file could be helpful, if a very large system is given or the system is not always available. In that case the user can connect to their system, save one or more snapshots into a capture file and analyse the created capture file later.
Another use case is, that their system from time to time some problems. In that case the user can activate the automatic mode and create the snapshots at specific intervals or based on specific MainDevice notifications.
- At the moment there are the following options:
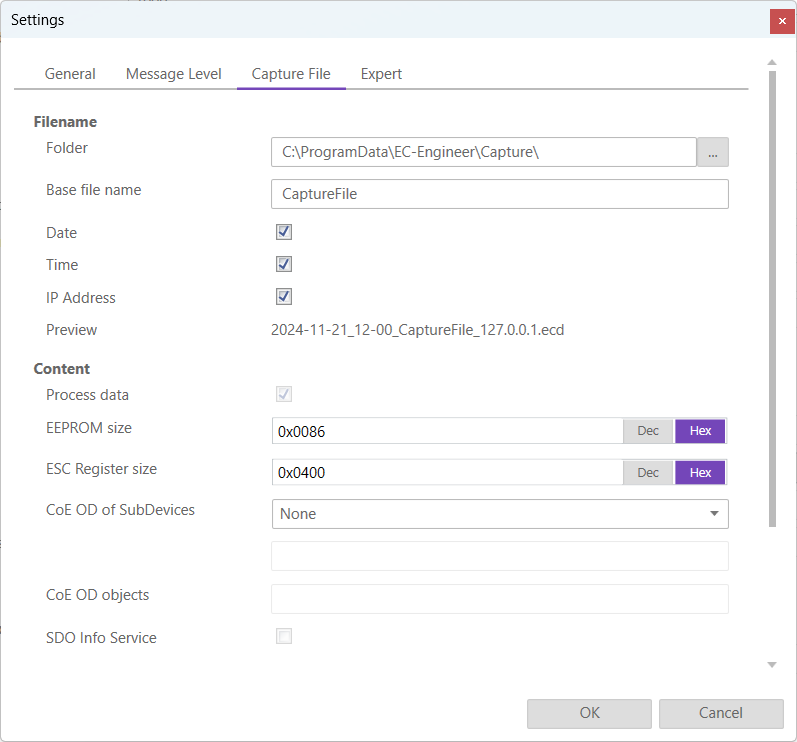
- Filename
- Folder:
Path, where the capture files should be saved
- Base file name:
Base file name of the generated capture file name
- Date:
Activate, to add the date to the generated capture file name
- Time:
Activate, to add the time to the generated capture file name
- IP Address:
Activate, to add the IP address to the generated capture file name
- Preview:
Shows a preview of the generated capture file name
- Content
- Process data:
Activate to add process data to the capture file (read-only)
- EEPROM size:
Enter size of the EEPROM (0x86 = default, 0 = no EEPROM)
- ESC Register size:
Enter size of the ESC Registers (0x400 = default, 0 = no ESC register)
- CoE OD of SubDevices:
- Select the SubDevices of which the CoE OD information will be captured
- None:
CoE OD will be not captured
- All:
CoE OD will be captured of all SubDevices
- User defined:
CoE OD will be captured of the defined SubDevices by physical address (e.g. 1001-1003; 1005)
- CoE OD objects:
Enter index of specific objects or all objects will be collected (e.g. 0x1018; 0x7000-0x7FFF)
- SDO Info Service:
Activate to use the SDO Info Service for loading the CoE Object Dictionary instead of readying the information from the
ESIfile.
- Automatic Mode
- Interval (min):
Time to wait until next snapshot will be taken
- Maximum Snapshots:
Enter count of maximum snapshots
- Notifications:
- Select the notifications, which will trigger a snapshot. The following notifications are availabe (for more information about notifications please refer the manual of EC-Master):
STATECHANGED
ETH_LINK_CONNECTED
ETH_LINK_NOT_CONNECTED
SLAVE_STATECHANGED
SLAVE_PRESENCE
SLAVE_INITCMD_RESPONSE_ERROR
STATUS_SLAVE_ERROR
SLAVE_UNEXPECTED_STATE
DC_SLV_SYNC
DCM_SYNC
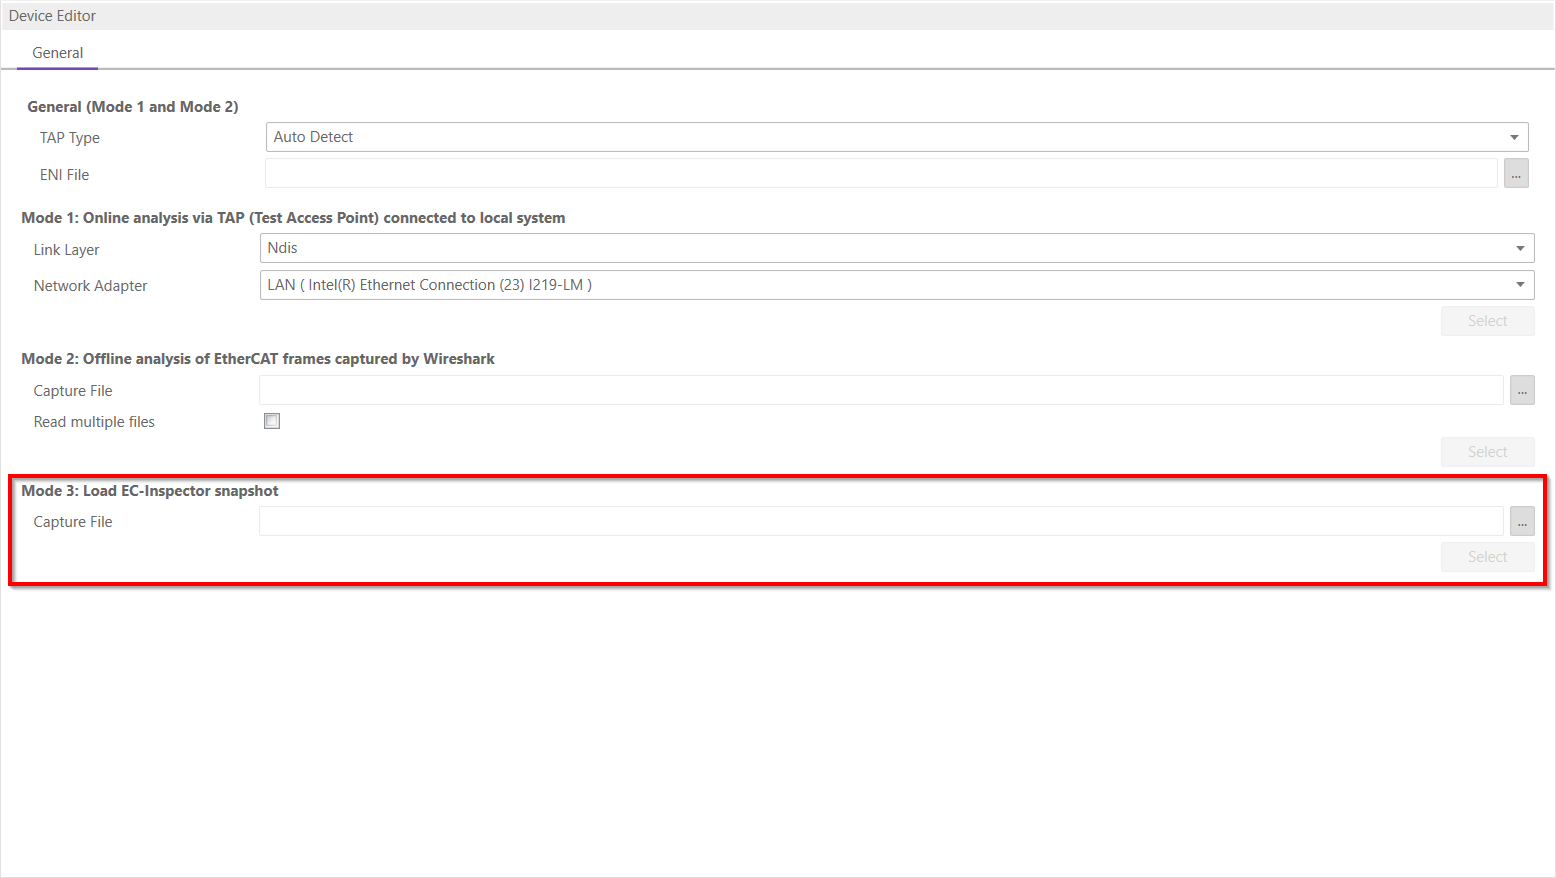
After the snapshot(s) is / are made in diagnosis mode they can be selected in the overview in config mode:
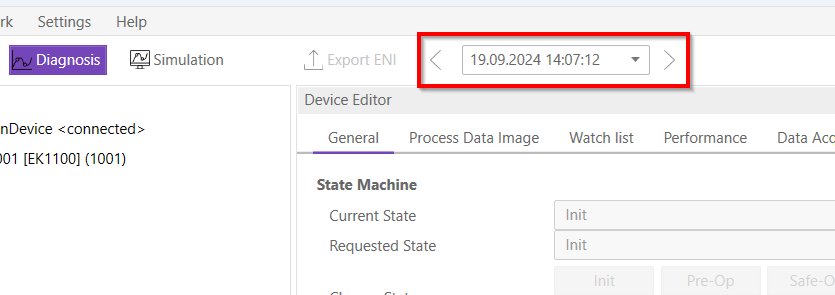
After the selection switching to diagnosis mode is possible. In the toolbar will be an additional combobox to select the snapshot and switch between them:
7.3.4. Expert
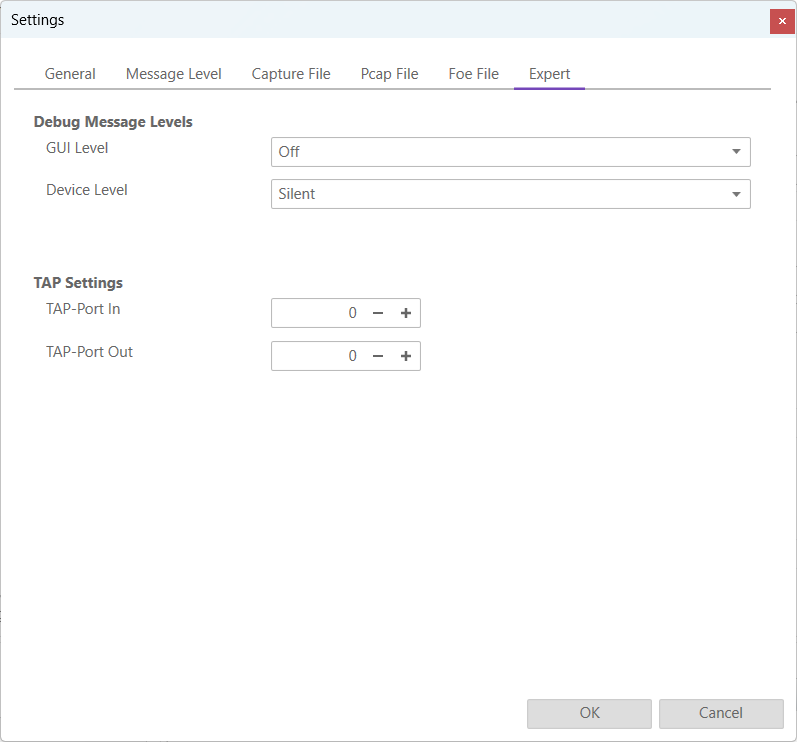
- Debug Message Levels
- GUI Level
Changes the GUI debug message level
- MainDevice Debug Message Level
Changes the MainDevice debug message level
- TAP Settings
- TAP-Port In
For ET2000: X1.0 = 10, X1.1 = 11, X2.0 = 20, …, X4.1 = 41. For other supported TAPs, this is the port number starting from 0. If both wMainTapPortIn and wMainTapPortOut are 0, no filtering is performed
- TAP-Port Out
See TAP-Port In
7.3.5. Pcap File
- With EC-Inspector it is possible to capture a
pcapfile, same as Wireshark. Open Settings/Pcap File and the follwing dialog appears: 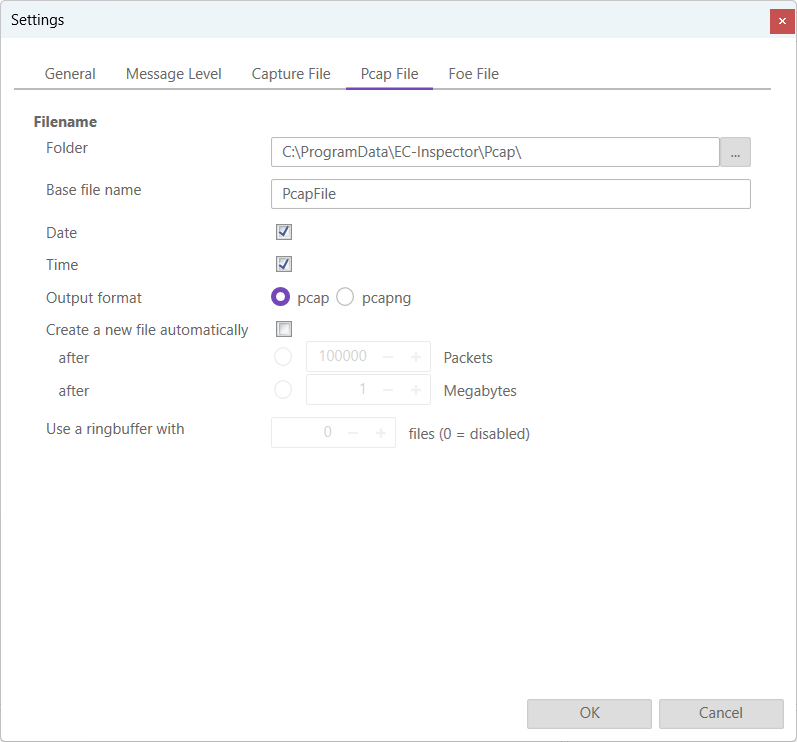
- Filename
- Folder:
Path, where the pcap files should be saved
- Base file name:
Base file name of the generated pcap file name
- Date:
Activate, to add the date to the generated pcap file name
- Time:
Activate, to add the time to the generated pcap file name
- Output format:
The output format can be selected. Pcap or pcapng
- Create a new file automatically:
A new file is created after one of the multiple file switch conditions is met. They will be named: name.00000.pcap. With the ringbuffer option a file is created if value is not reached, otherwise it will replace the oldest of the formerly used files (thus forming a “ring”). This mode will limit the maximum disk usage, even for an unlimited amount of capture input data, only keeping the latest captured data.
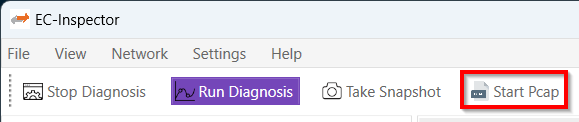
- On the toolbar will be a new button in diagnosis mode to start and stop the pcap file recorder:
It is also possible to record a pcap backtrace file. When EC-Inspector is in pause mode (e.g. from a trigger condition) the user can capture the last 64 frames via the backtrace button in the toolbar.
After the capture is made in diagnosis mode it can be selected in the overview in config mode as described in the previous chapter Wireshark File.
7.3.6. FoE File
- With EC-Inspector it is possible to capture a file which is transferred via FoE. Open Settings/FoE File and the follwing dialog appears:
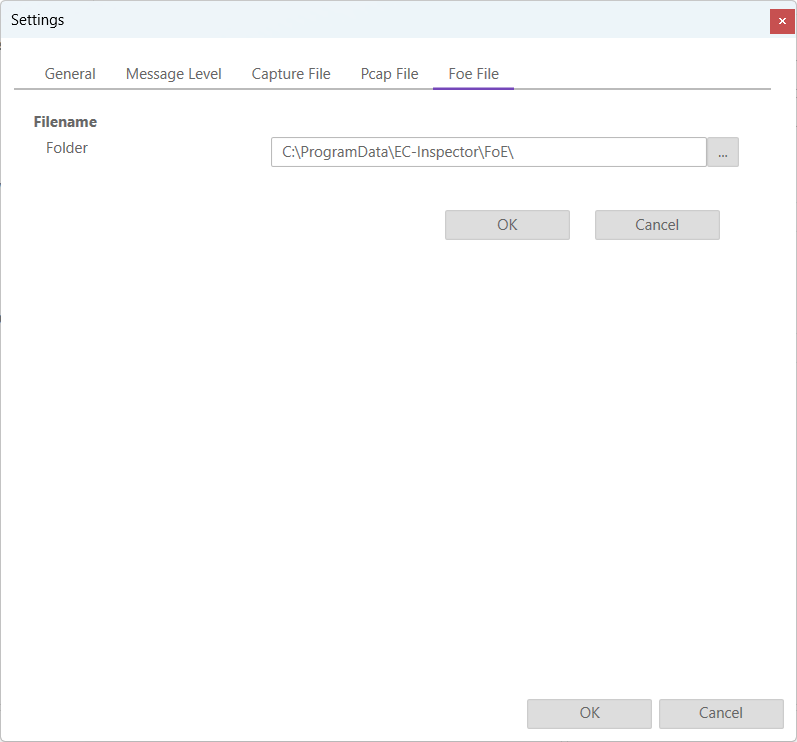
- Filename
- Folder:
Path, where the FoE files should be saved
7.3.6.1. Wireshark File
With the EC-Inspector it is possible to analyze a previous recorded catupre file pcap or pcapng.
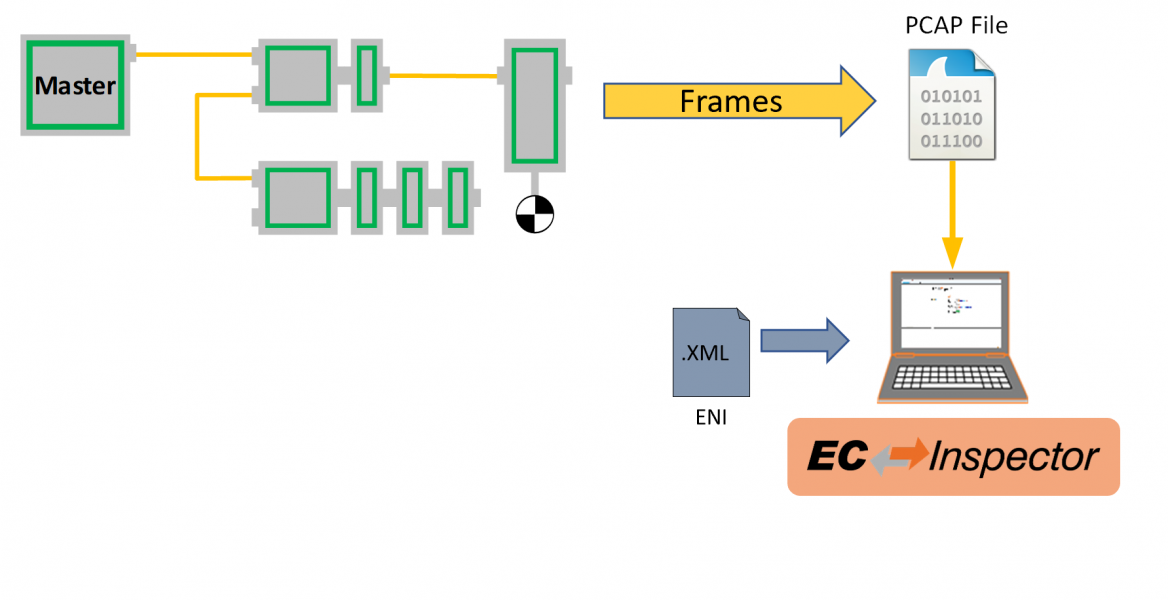
Therefore a wireshark have to be captured and saved as pcap or pcapng. Then it can be selected in the starting view of the EC-Inspector. Also the ENI file has to be selected.
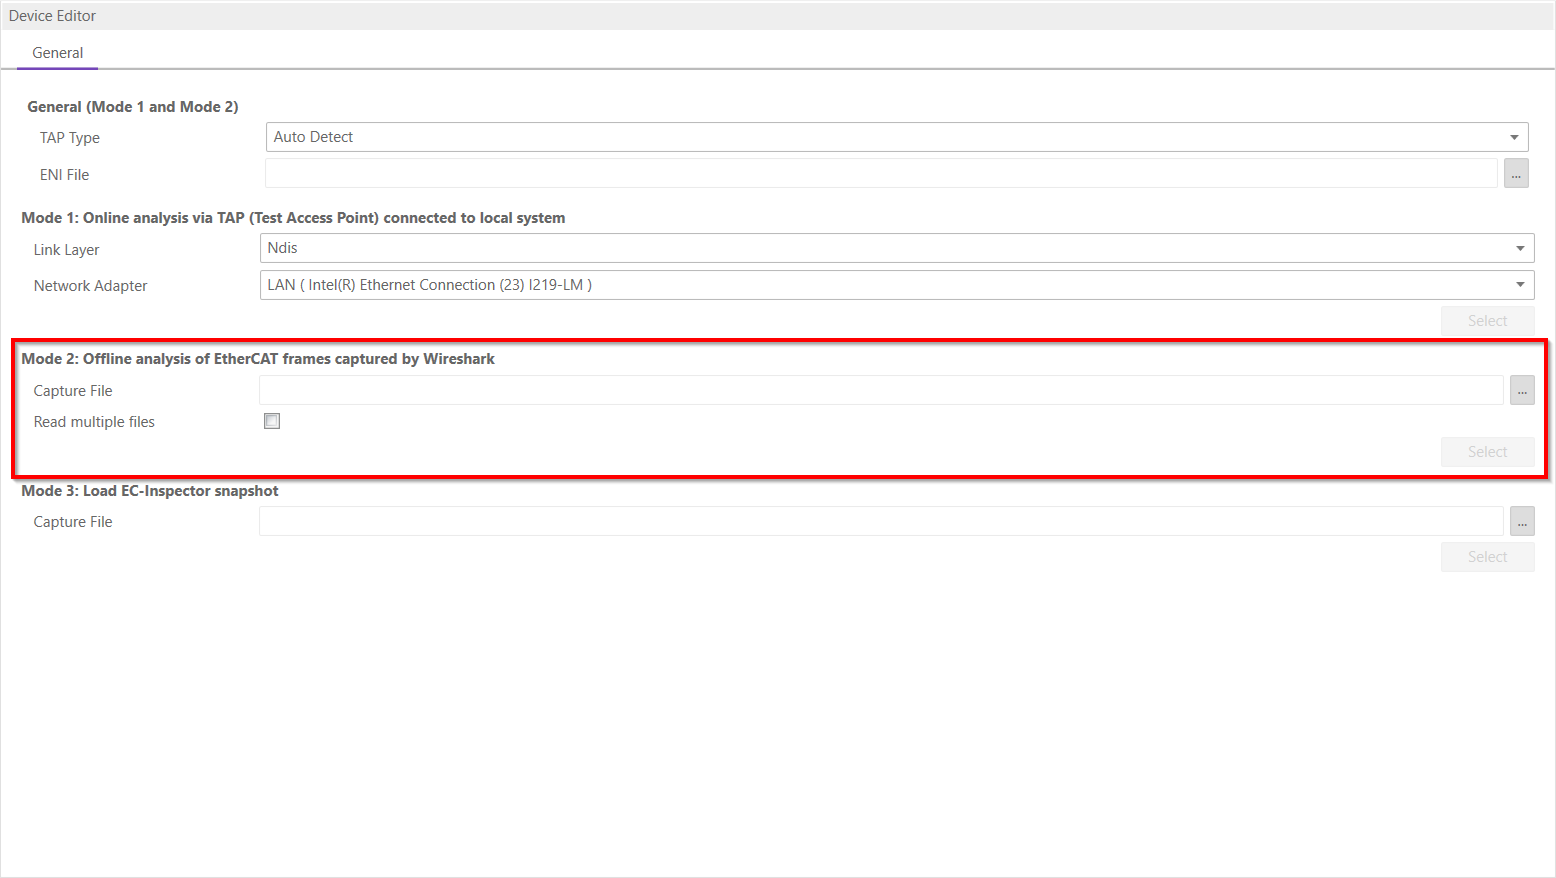
It is also possible to read multiple files. Therefore the pcap files have to named like that: name.00000.pcap.
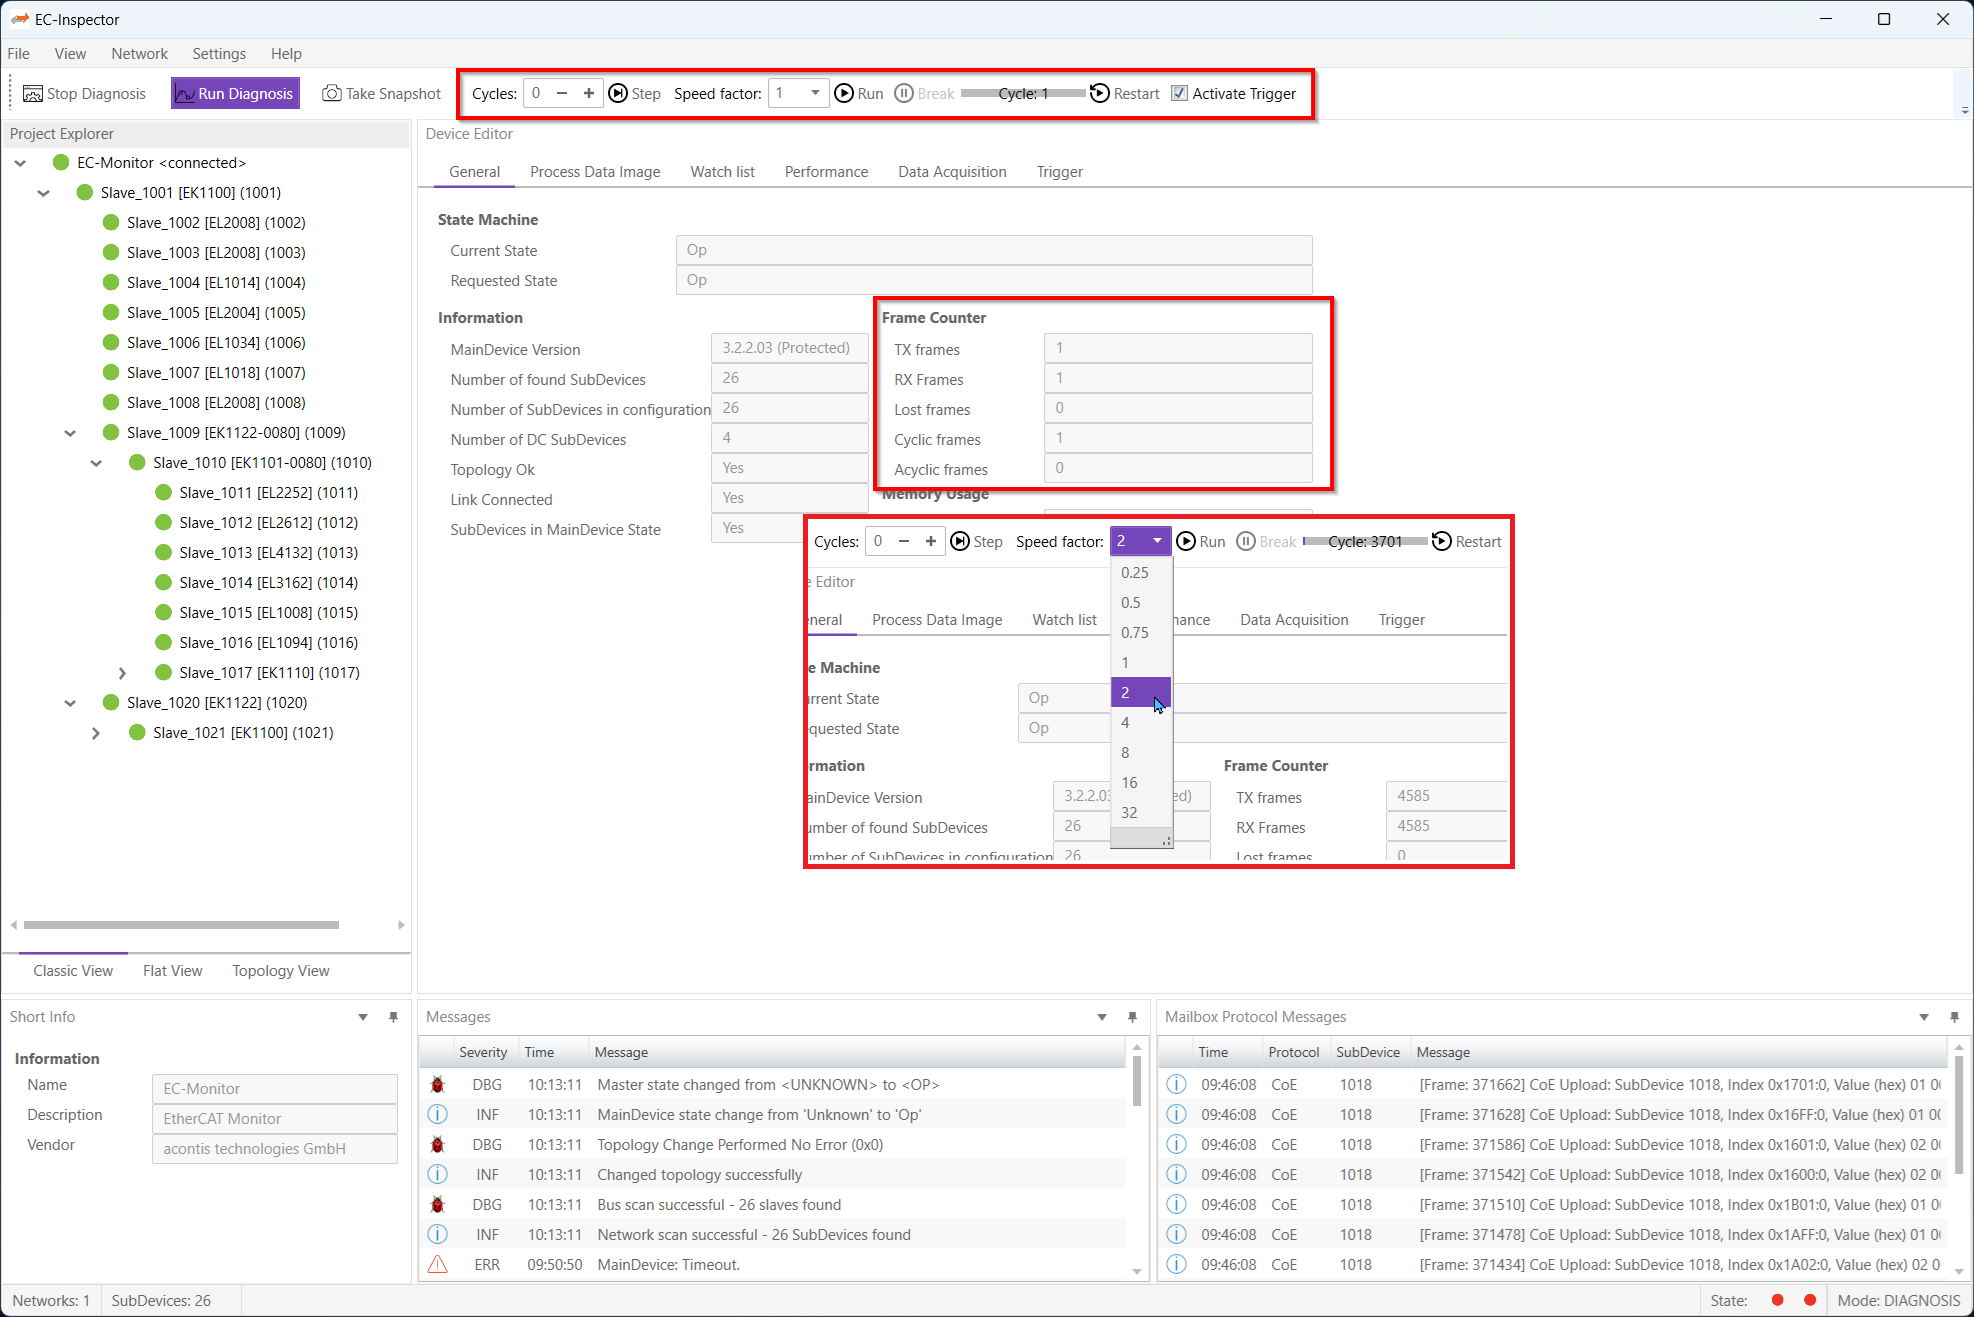
On switching to diagnosis mode the file will be read by EC-Monitor. After that the file is in play mode. It is possible to play the file faster or slower or select pause. There is also a function to execute a specified amount of cycles. This can all be done in the toolbar:
7.3.7. Settings File
Inside this file the user can modify all settings, including some that are not present in the settings dialog.
Warning
Only modify this file if you know what you are doing.
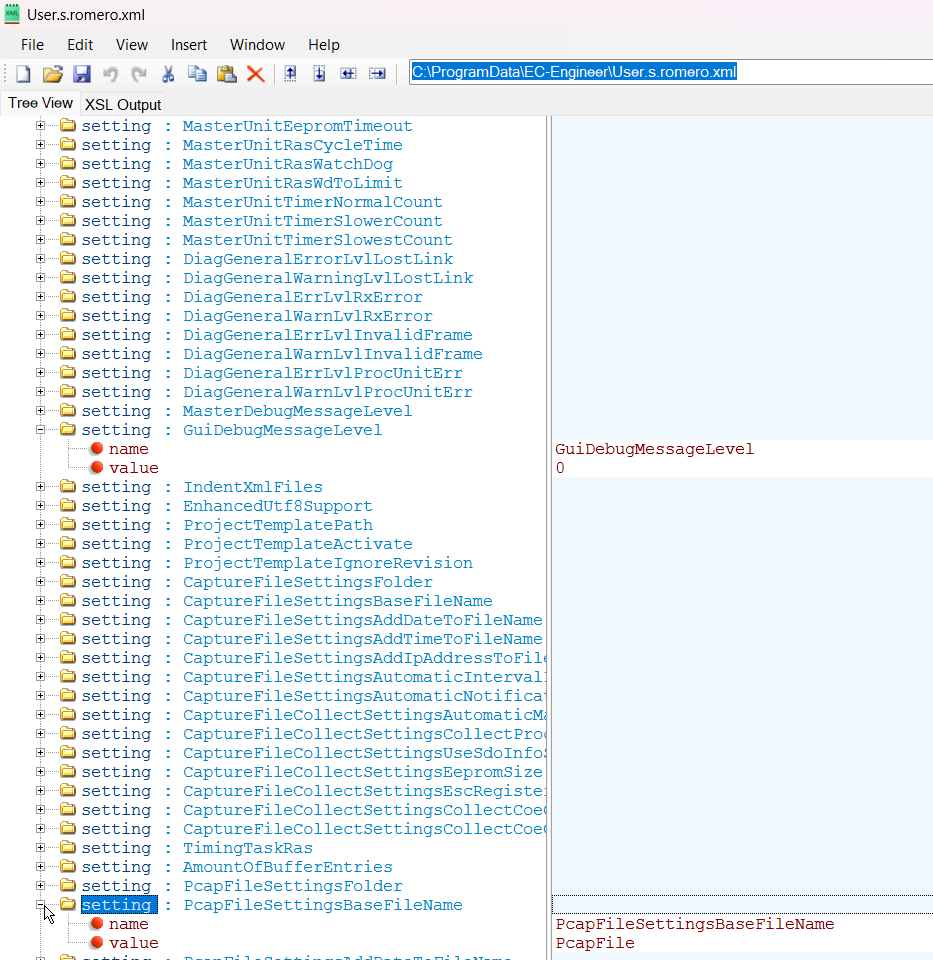
The file can be located either at “C:/ProgramData/EC-Engineer/User.<username>.xml” or insdie the install directory.