6. Additional Tools
6.1. ESI-Manager
ESI-Manager can be found through the main menu File -> ESI-Manager.
- This dialog helps the user to administrate his
ESIandSCIfiles. Here, he can add/delete/exportESIandSCIfiles. 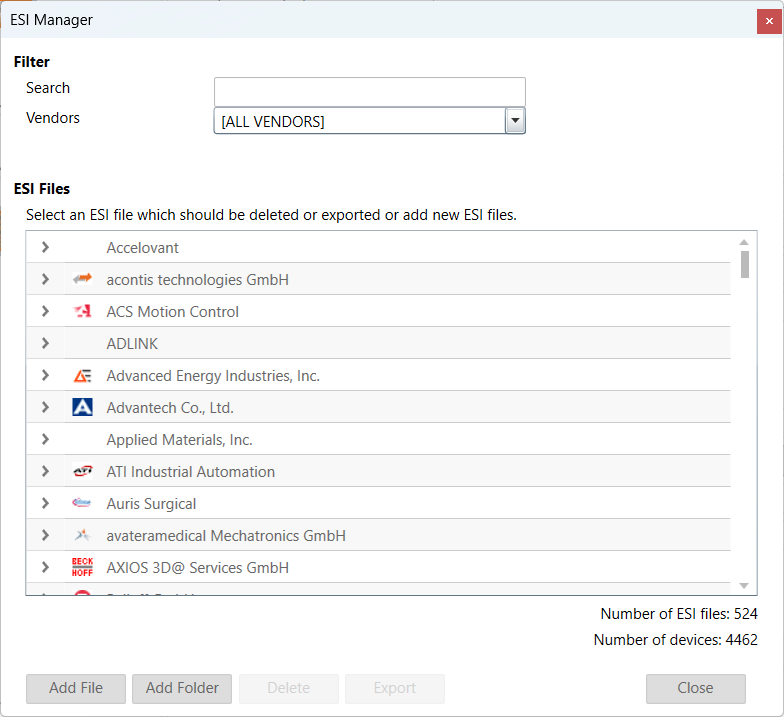
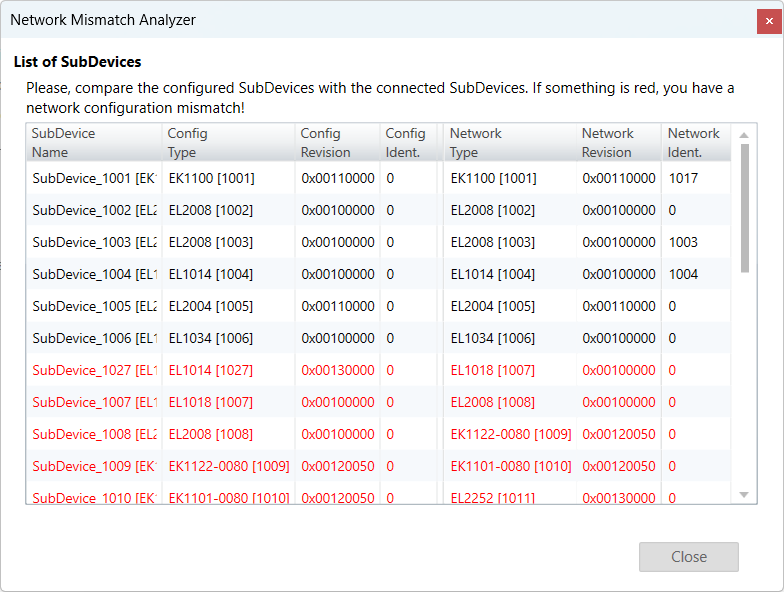
6.2. Network Mismatch Analyzer
- If you have a network mismatch in your EtherCAT network it is not so easy to find the problem. For this you have the Network Mismatch Analyzer. You find it in the network main menu. If you see here some “red” entries, means that this is the start point of your network mismatch:
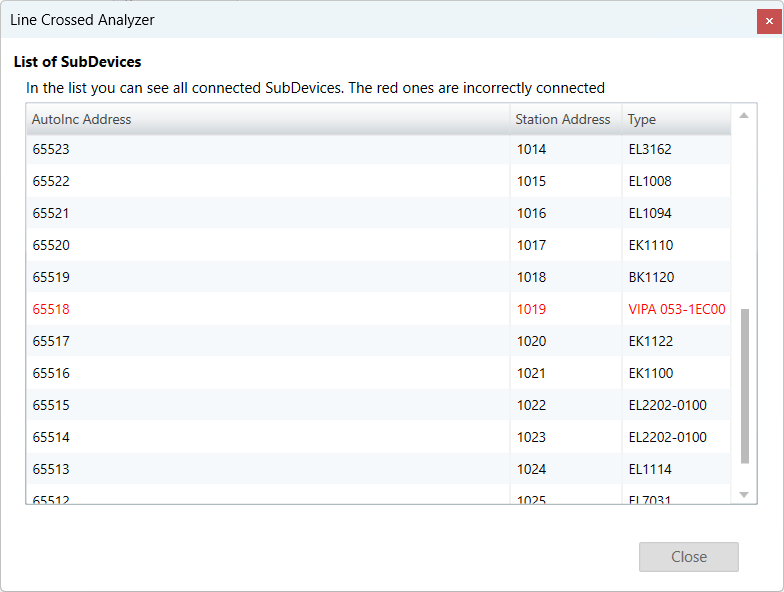
6.3. Line Crossed Analyzer
- If you have connected a line to a wrong port, you can see in the Line Crossed Analyzer which SubDevice is incorrectly connected. The wron entries will be red:
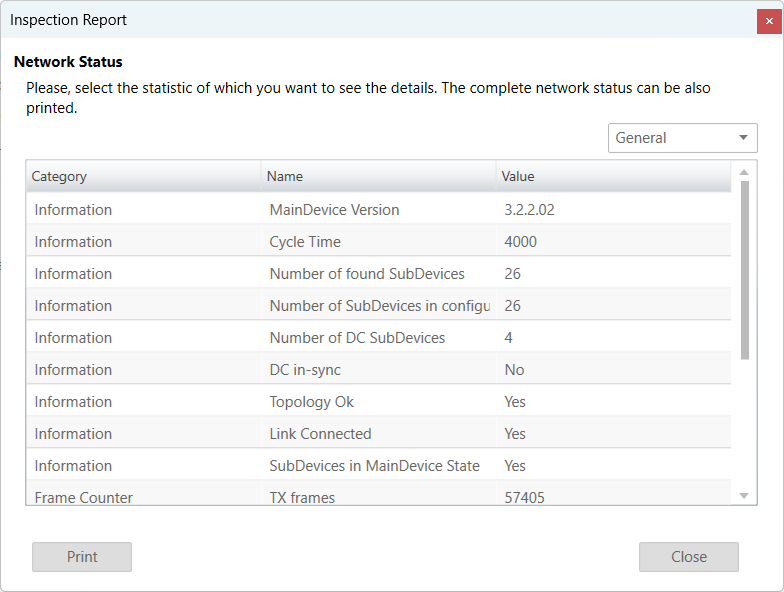
6.4. Inspection Report
- If you want to print or show a report about the actual session, it is possible with the inspection report. I shows a lot of different data about the network communication. It is also possible to print a PDF.
6.5. EoE Endpoint Configuration
If you want to use EoE SubDevices with your local MainDevice, you can activate the EoE Endpoint.
Note
This feature is only available if the package “Tap-Windows” from OpenVPN is installed: http://openvpn.net/index.php/download/community-downloads.html
- If this package is installed, you will see the following dialog:
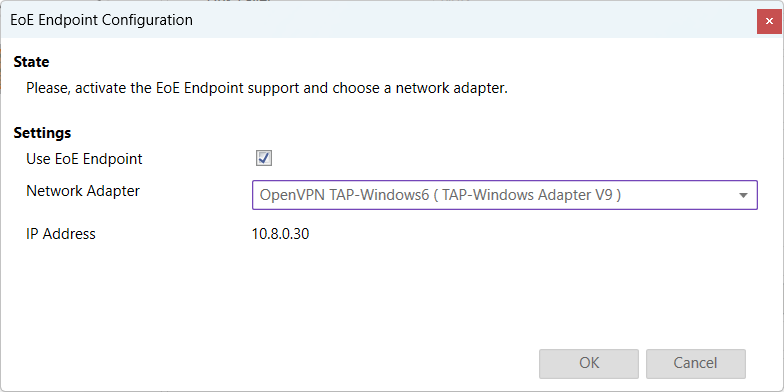
- Settings
- Use EoE Endpoint:
Activate EoE Endpoint support for the selected device
- Network Adapter:
List of installed network adapters (TAP)
- IP Address:
IP Address of the selected network adapter
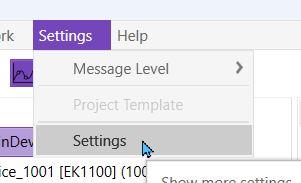
6.6. Settings
Can be found inside the settings menu bar.
6.6.1. General
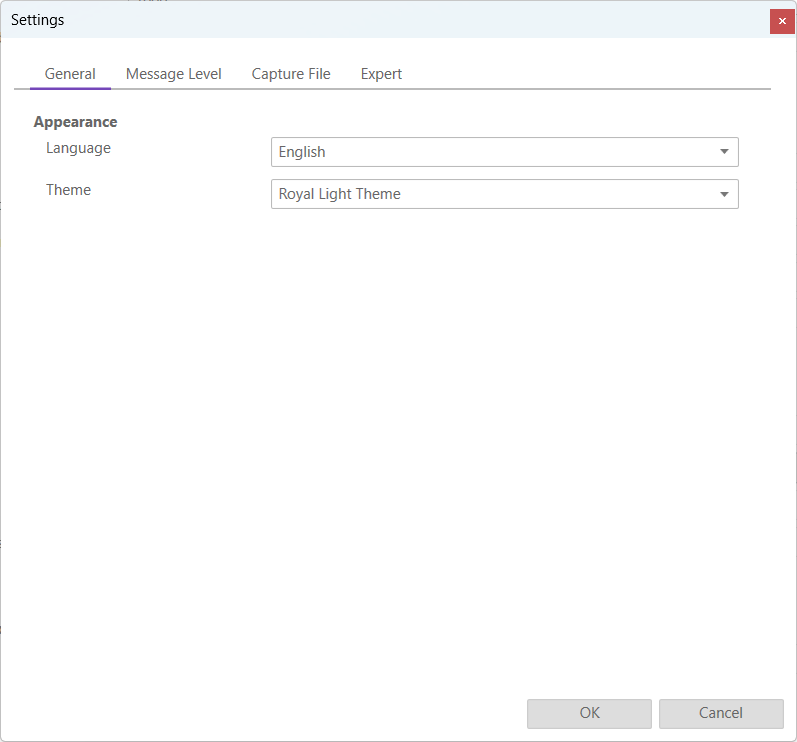
- Appearance
- Language:
Changes the current language
- Theme:
Changes the current theme
6.6.2. Message Level
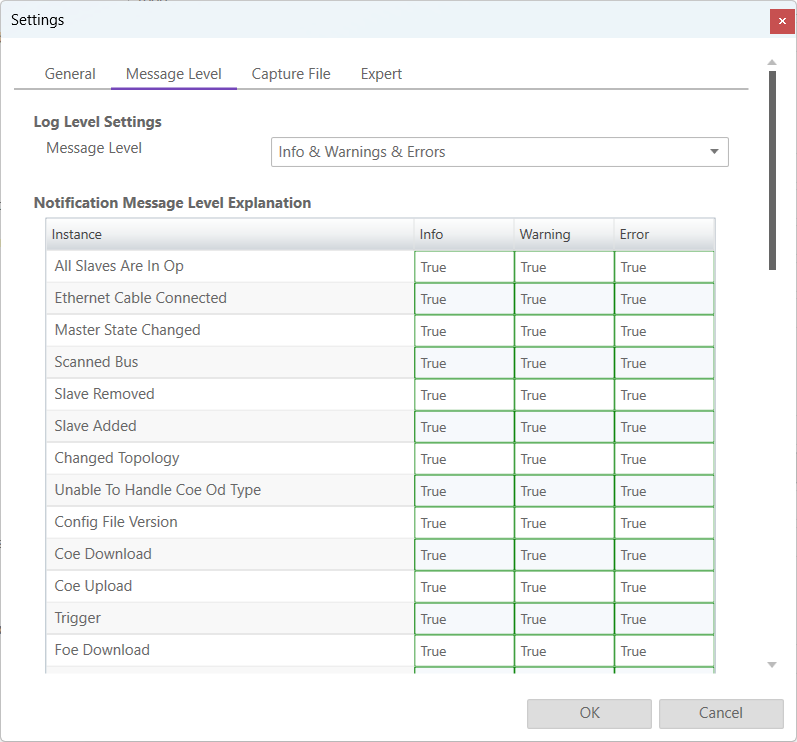
In this tab the log level of the message panel can be changed.
- Log Level Settings
- Message Level:
Changes what messages are displayed on the message panel
- Explanation
We can see what messages are displayed depending on the selected message level (true it is displayed, false it is not displayed)
6.6.3. Capture File
A capture file could be helpful, if a very large system is given or the system is not always available. In that case the user can connect to their system, save one or more snapshots into a capture file and analyse the created capture file later.
Another use case is, that their system from time to time some problems. In that case the user can activate the automatic mode and create the snapshots at specific intervals or based on specific MainDevice notifications.
- At the moment there are the following options:
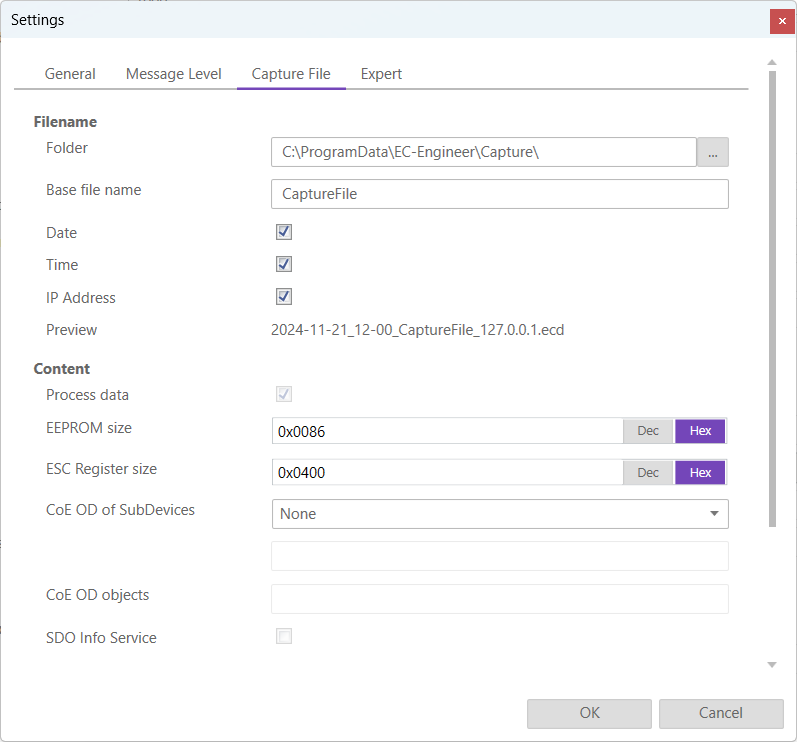
- Filename
- Folder:
Path, where the capture files should be saved
- Base file name:
Base file name of the generated capture file name
- Date:
Activate, to add the date to the generated capture file name
- Time:
Activate, to add the time to the generated capture file name
- IP Address:
Activate, to add the IP address to the generated capture file name
- Preview:
Shows a preview of the generated capture file name
- Content
- Process data:
Activate to add process data to the capture file (read-only)
- EEPROM size:
Enter size of the EEPROM (0x86 = default, 0 = no EEPROM)
- ESC Register size:
Enter size of the ESC Registers (0x400 = default, 0 = no ESC register)
- CoE OD of SubDevices:
- Select the SubDevices of which the CoE OD information will be captured
- None:
CoE OD will be not captured
- All:
CoE OD will be captured of all SubDevices
- User defined:
CoE OD will be captured of the defined SubDevices by physical address (e.g. 1001-1003; 1005)
- CoE OD objects:
Enter index of specific objects or all objects will be collected (e.g. 0x1018; 0x7000-0x7FFF)
- SDO Info Service:
Activate to use the SDO Info Service for loading the CoE Object Dictionary instead of readying the information from the
ESIfile.
- Automatic Mode
- Interval (min):
Time to wait until next snapshot will be taken
- Maximum Snapshots:
Enter count of maximum snapshots
- Notifications:
- Select the notifications, which will trigger a snapshot. The following notifications are availabe (for more information about notifications please refer the manual of EC-Master):
STATECHANGED
ETH_LINK_CONNECTED
ETH_LINK_NOT_CONNECTED
SLAVE_STATECHANGED
SLAVE_PRESENCE
SLAVE_INITCMD_RESPONSE_ERROR
STATUS_SLAVE_ERROR
SLAVE_UNEXPECTED_STATE
DC_SLV_SYNC
DCM_SYNC
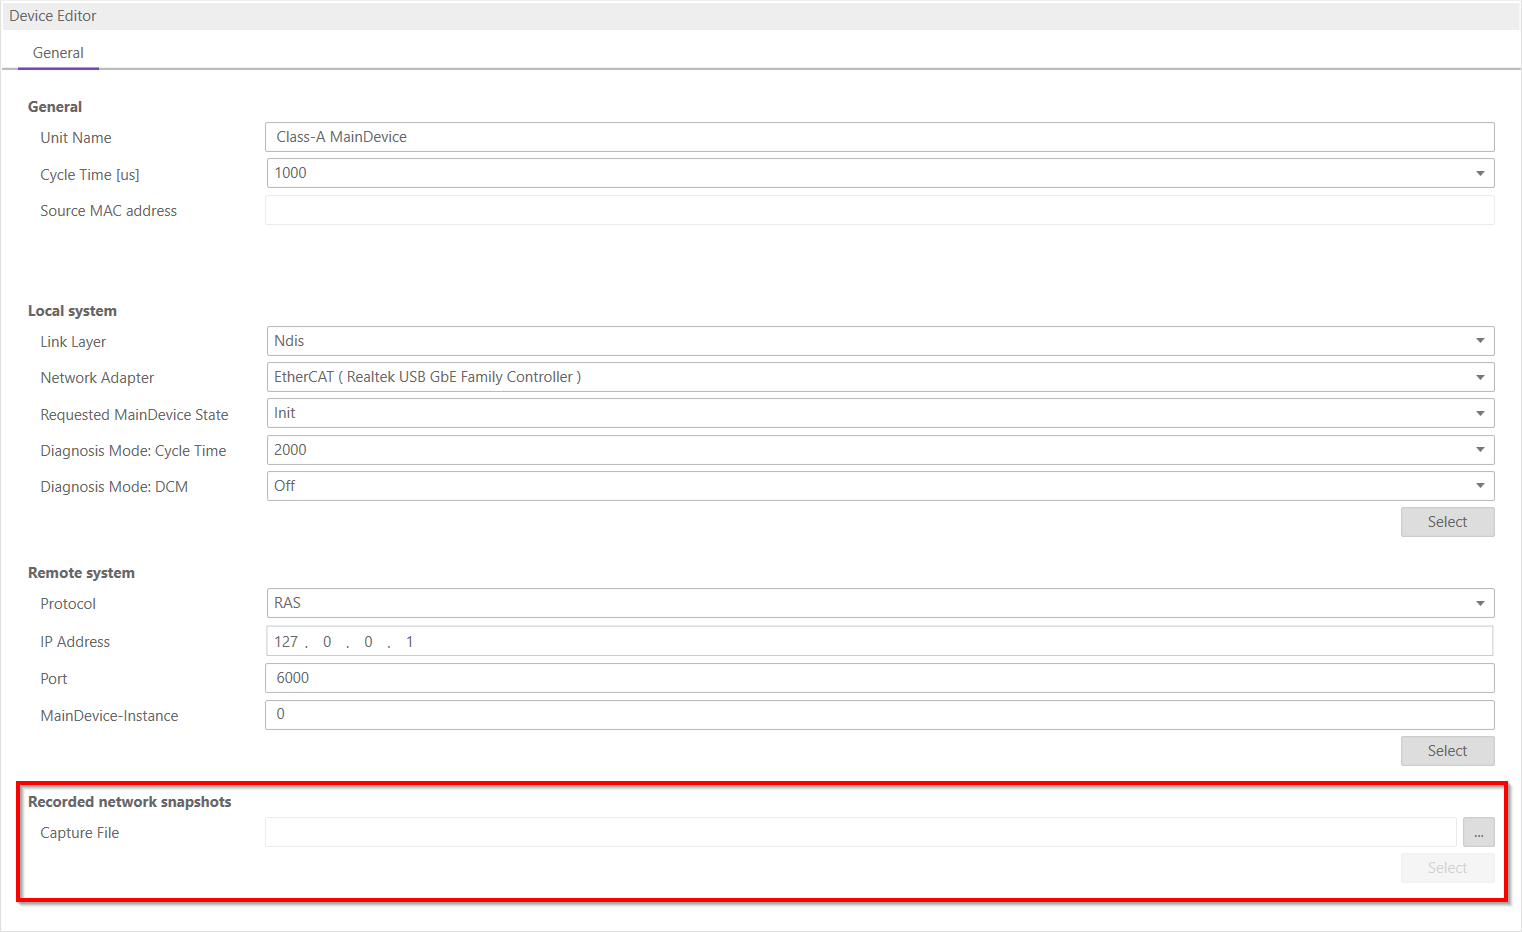
After the snapshot(s) is / are made in diagnosis mode they can be selected in the overview in config mode:
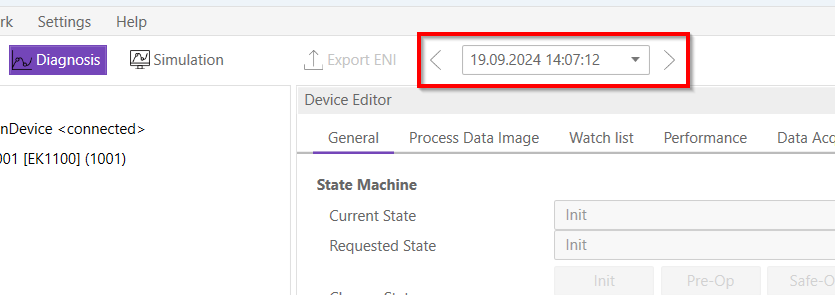
After the selection switching to diagnosis mode is possible. In the toolbar will be an additional combobox to select the snapshot and switch between them:
6.6.4. Expert
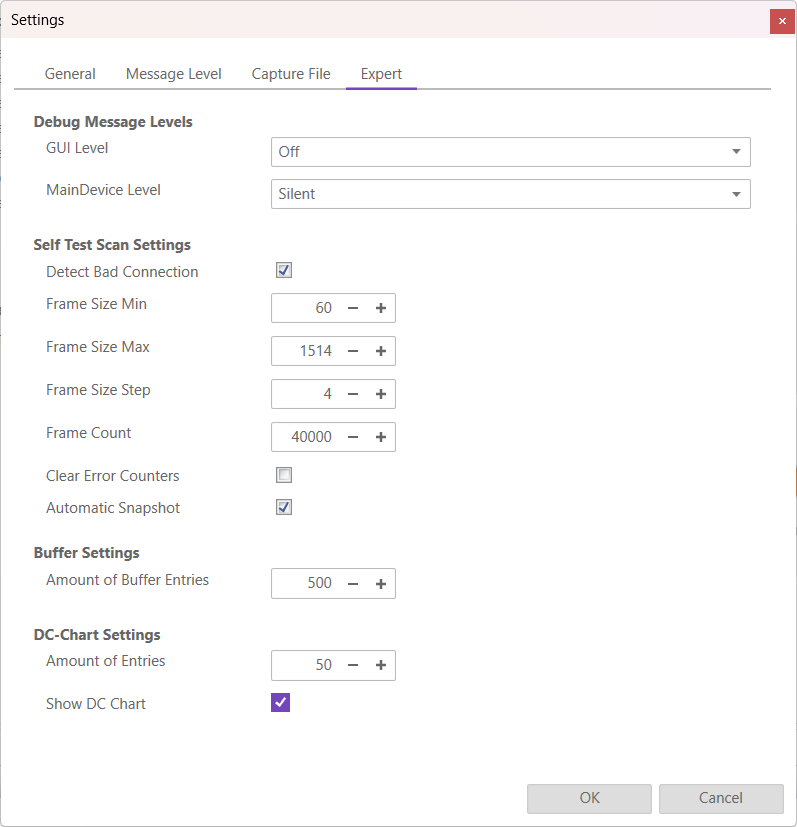
- Debug Message Levels
- GUI Level
Changes the GUI debug message level
- MainDevice Debug Message Level
Changes the MainDevice debug message level
- Self Test Scan Settings
- Detect Bad Connection
(De-)Activates bad connection detection
- Frame Size Min
Changes the min frame size
- Frame Size Max
Changes the max frame size
- Frame Size Step
Changes the frame step size
- Frame Count
Changes the frame count
- Clear Error Counters
Resets the error counters on the MainDevice
- Automatic Snapshots
Enables the creation of a snapshot after running a successful Self Test Scan
- Buffer Settings
- Amount of Buffer Entries
Changes the amount of entries in the Buffer/Charts (eg. Variables)
- DC-Chart Settings
- Amount of Entries
Changes only the amount of entries in the chart in the DC Diagnosis Tab
- Show DC Chart
Check to display the chart in the DC Diagnosis Tab
6.6.5. Settings File
Inside this file the user can modify all settings, including some that are not present in the settings dialog.
Warning
Only modify this file if you know what you are doing.
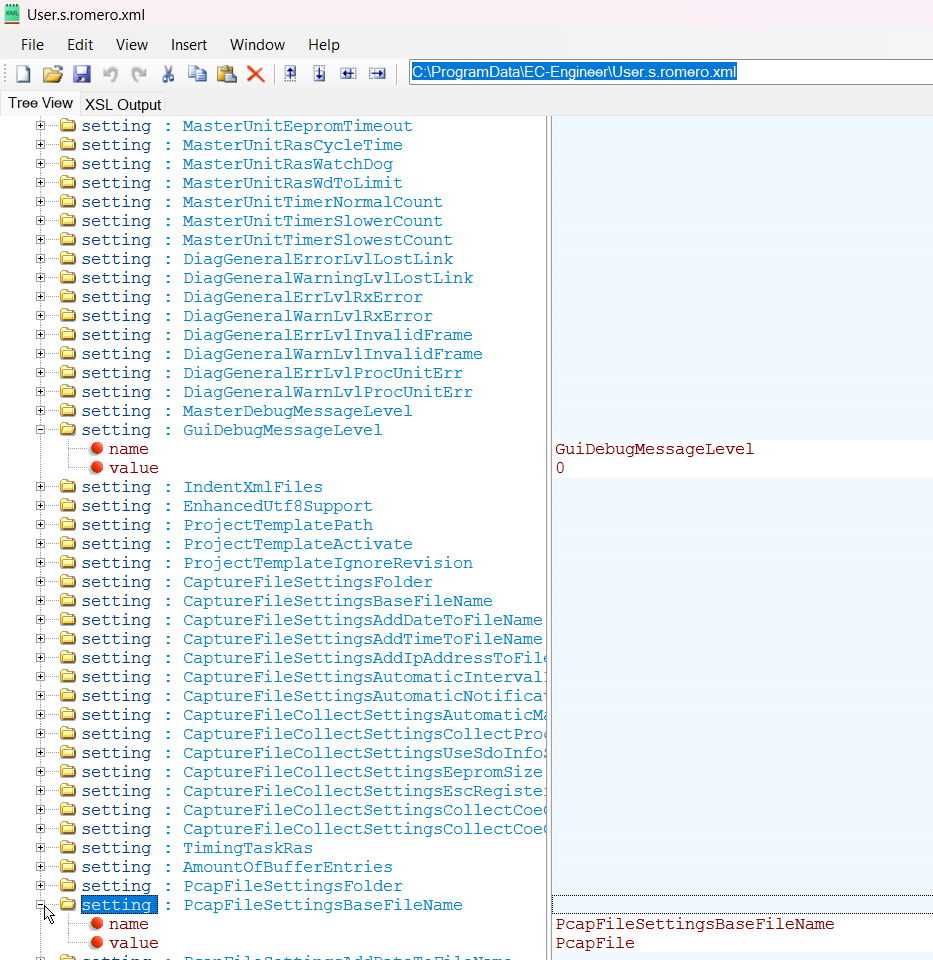
The file can be located either at “C:/ProgramData/EC-Engineer/User.<username>.xml” or insdie the install directory.
6.7. Real-time Support
Normally on Windows you do not have real-time support, but to get DCM in sync you can install the “ECAT driver” in the following modes:
- Network driver
The network driver can be used from the optimized link layers
The real-time support is normally hidden in EC-Lyser. It can be activate by copying the specific link layer libraries into the installation directory of EC-Lyser.
For the local system, EC-Lyser will turn on DCM and use the real-time clock for generating the job task cylces. For more information about how to install the “ECAT driver” please refer the manual of EC-Master Class A DCM on Windows
6.7.1. Optimized Link Layers
- After activating the real-time support the optimized link layer can be selected in the option “Link Layer”:
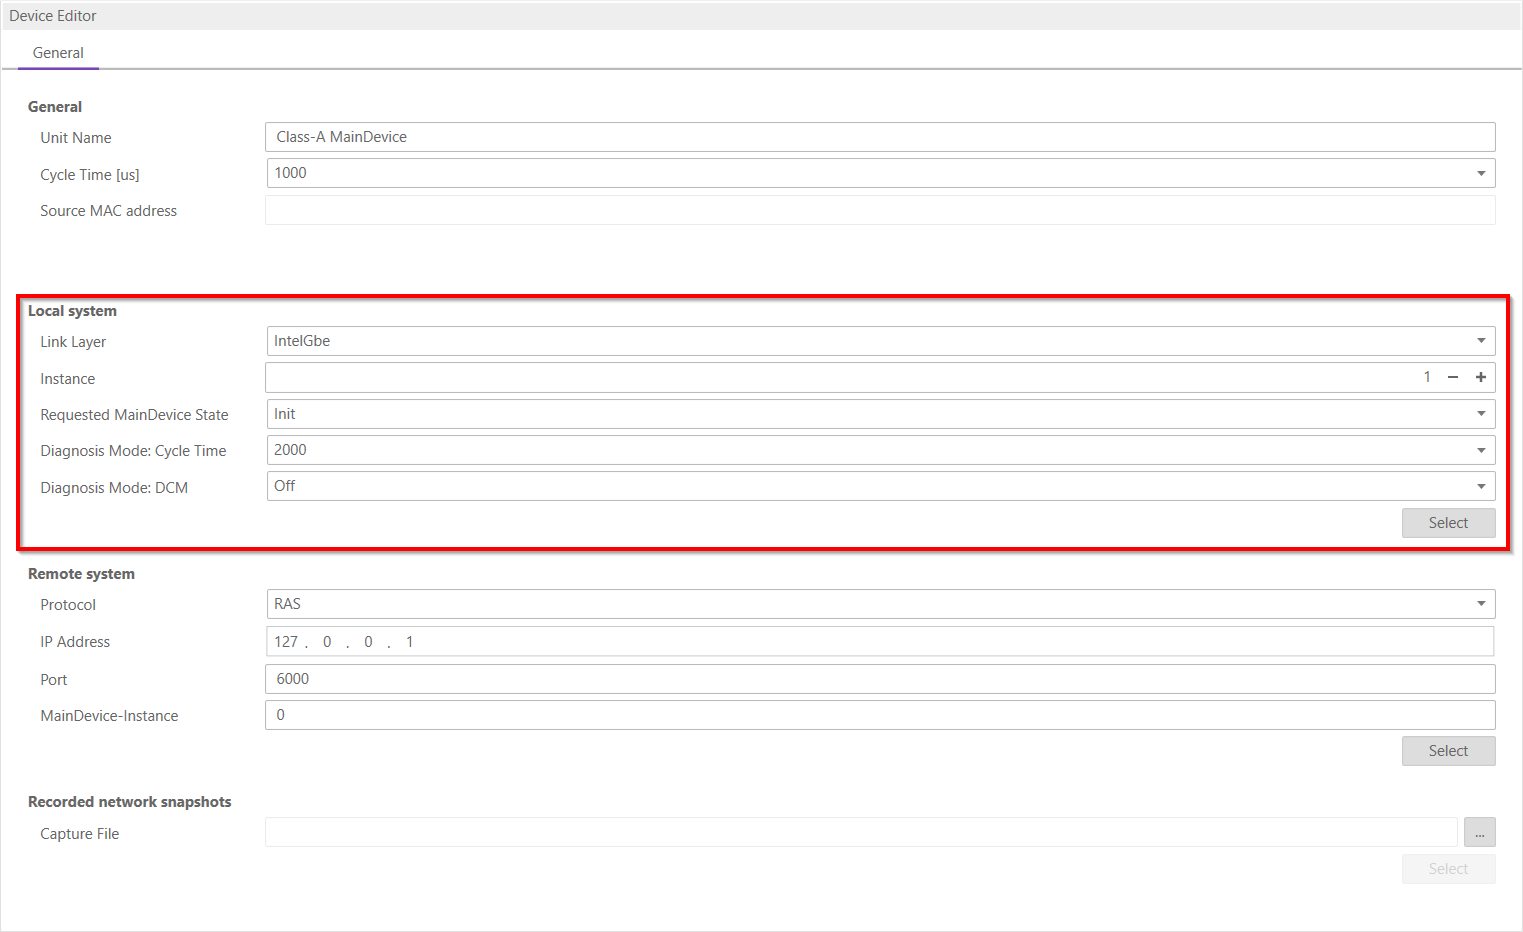
Depending on the link layer type the user can chose the network adapter or the instance.
The following optimized link layers are currenty supported:
emllI8254x.dll (Intel PRO/1000 Network Adapters)
emllI8255x.dll (Intel PRO/100 Network Adapters)
emllIRTL8139.dll (Realtek 8139 Fast Ethernet Adapters)
emllIRTL8169.dll (Realtek Gigabit Ethernet Adapters)
emllICCAT.dll (BECKHOFF CCAT)
For more information about optimized link layers and how to install the ECAT driver please refer the manual of EC-Master Class B EcatDrv for Optimized Link Layers