6. Additional Tools
6.1. Capture File
A capture file could be helpful, if you have a very large system or system is not always available. In that case you can connect to your system, save one or more snapshots into a capture file and analyse the created capture file later.
Another use case is, that your system from time to time has some problems. In this case you can activate the automatic mode and create the snapshots every specific interval or based on specific master notifications.
- At the moment there are the following options:
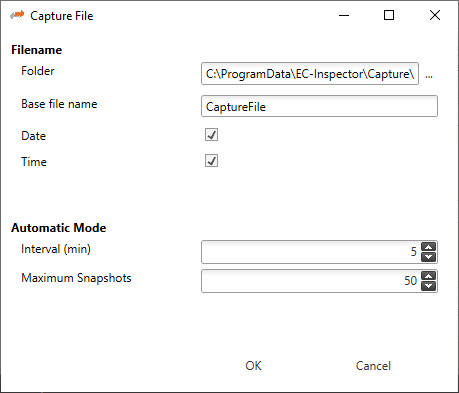
- Filename
- Folder:
Path, where the capture files should be saved
- Base file name:
Base file name of the generated capture file name
- Date:
Activate, to add the date to the generated capture file name
- Time:
Activate, to add the time to the generated capture file name
- Automatic Mode
- Interval (min):
Time to wait until next snapshot will be taken
- Maximum Snapshots:
Enter count of maximum snapshots
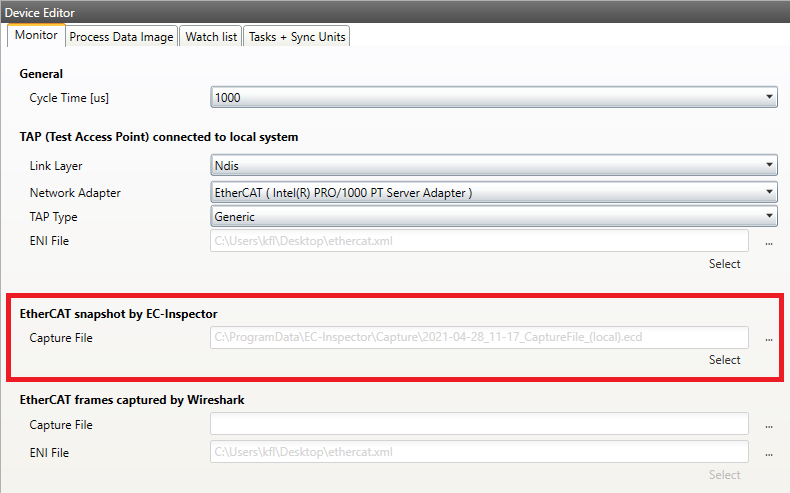
- After the snapshot(s) is / are made in diagnosis mode they can selected in the overview in config mode:
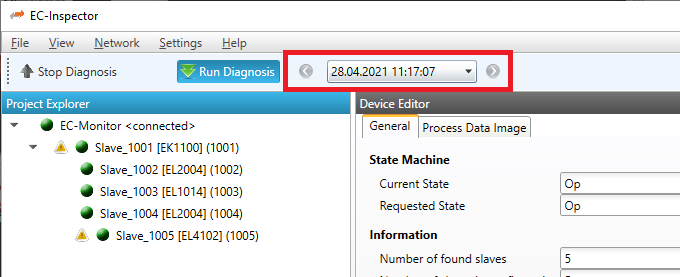
- After the selection switching to diagnosis mode is possible. In the toolbar will be an additional combobox to select the snapshot and switch between them:
6.2. Wireshark File
With the EC-Inspector it is possible to analyze a previous recorded catupre file pcap or pcapng.
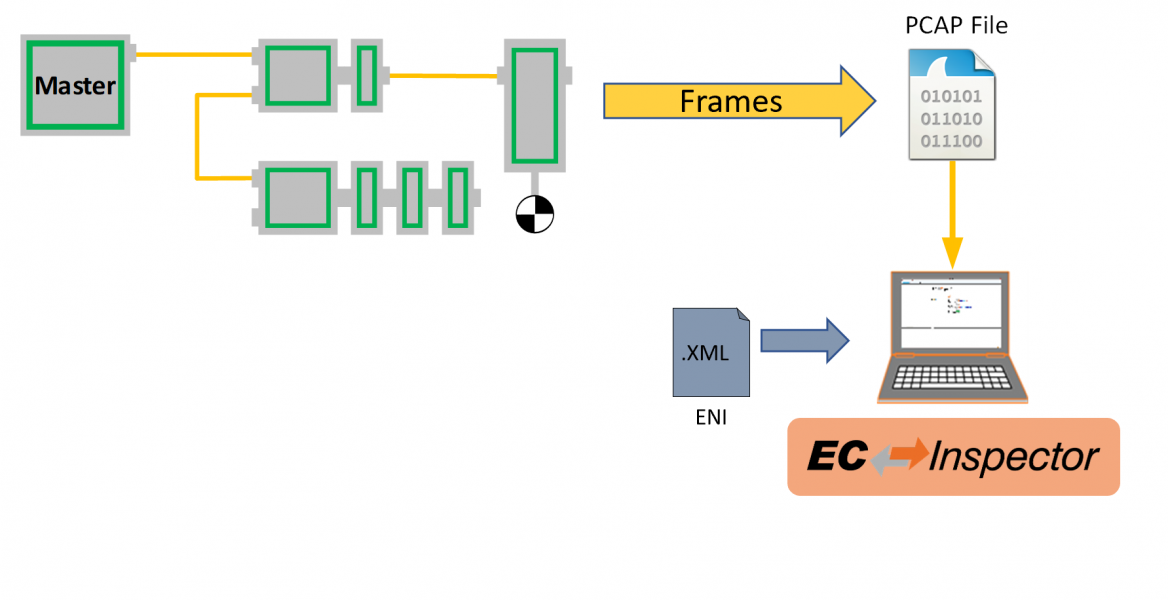
Therefore a wireshark have to be captured and saved as pcap or pcapng. Then it can be selected in the starting view of the EC-Inspector. Also the ENI file has to be selected.
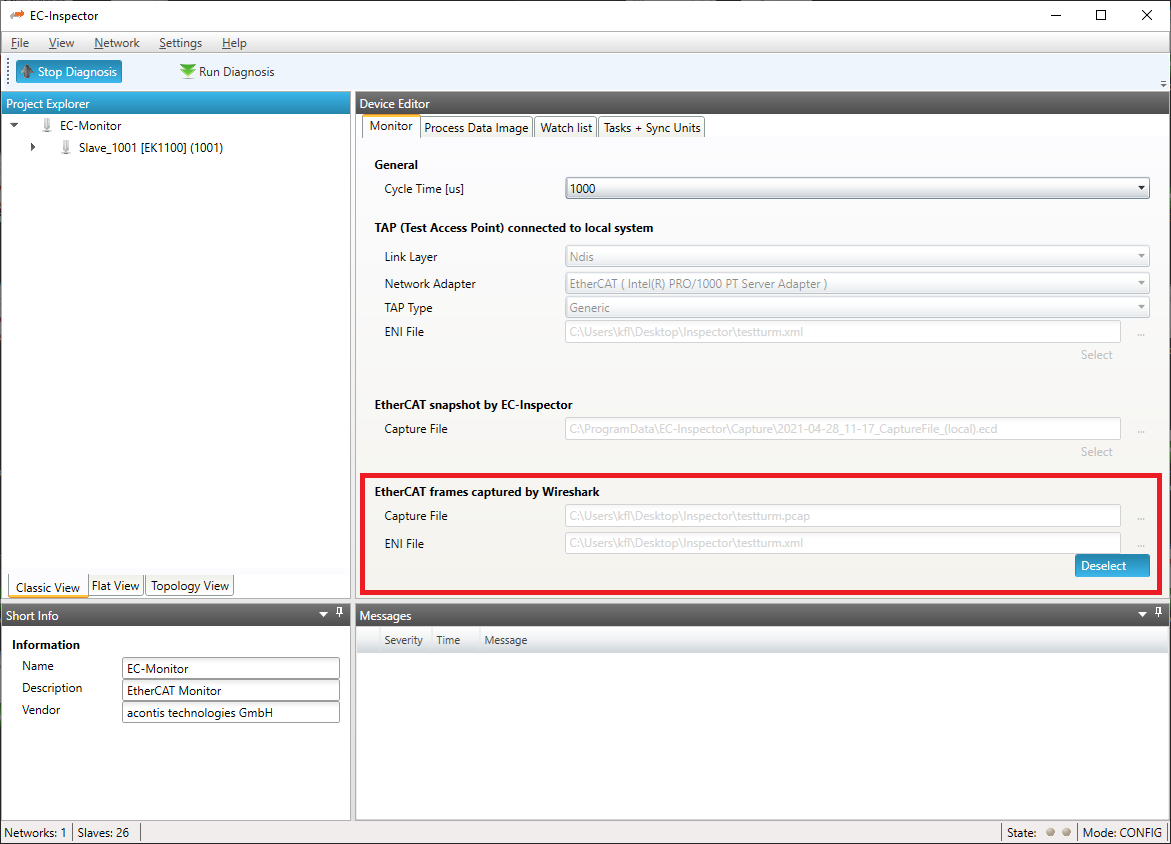
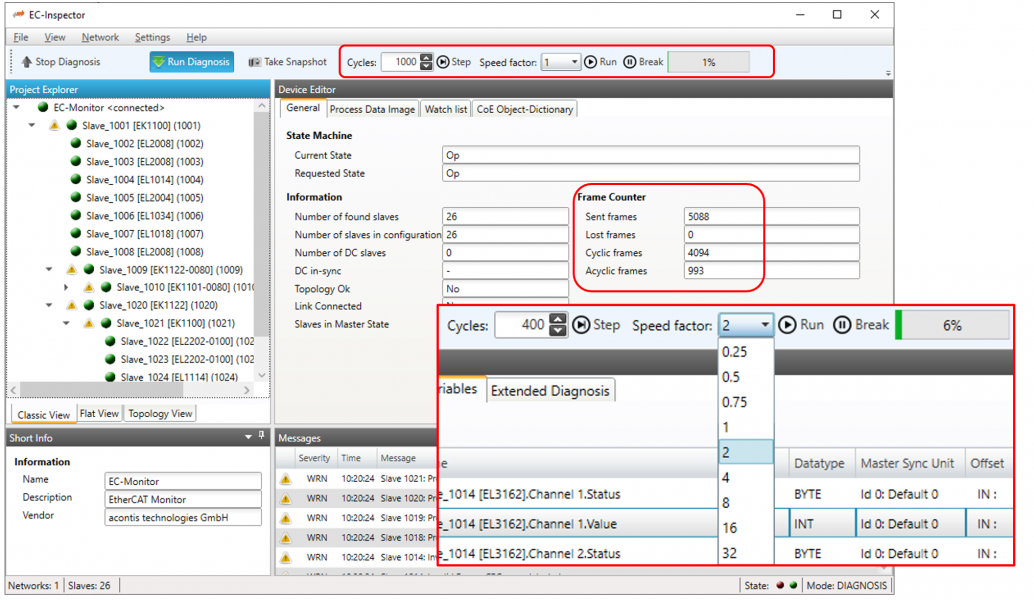
On switching to diagnosis mode the file will be read by EC-Monitor. After that the file is in play mode. It is possible to play the file faster or slower or select pause. There is also a function to execute a specified amount of cycles. This can all be done in the toolbar:
6.3. Pcap File
- With EC-Inspector it is possible to capture a
pcapfile, same as Wireshark. Open Settings/Pcap File and the follwing dialog appears: 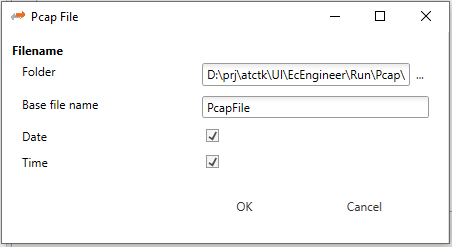
- Filename
- Folder:
Path, where the pcap files should be saved
- Base file name:
Base file name of the generated pcap file name
- Date:
Activate, to add the date to the generated pcap file name
- Time:
Activate, to add the time to the generated pcap file name
- On the toolbar will be a new button in diagnosis mode to start and stop the pcap file recorder:
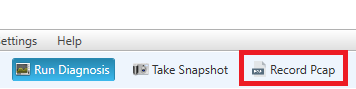
It is also possible to record a pcap backtrace file. When EC-Inspector is in pause mode (e.g. from a trigger condition) the user can capture the last 64 frames via the backtrace button in the toolbar.
After the capture is made in diagnosis mode it can be selected in the overview in config mode as described in the previous chapter Wireshark File.