4. Configuration Mode
4.1. Overview
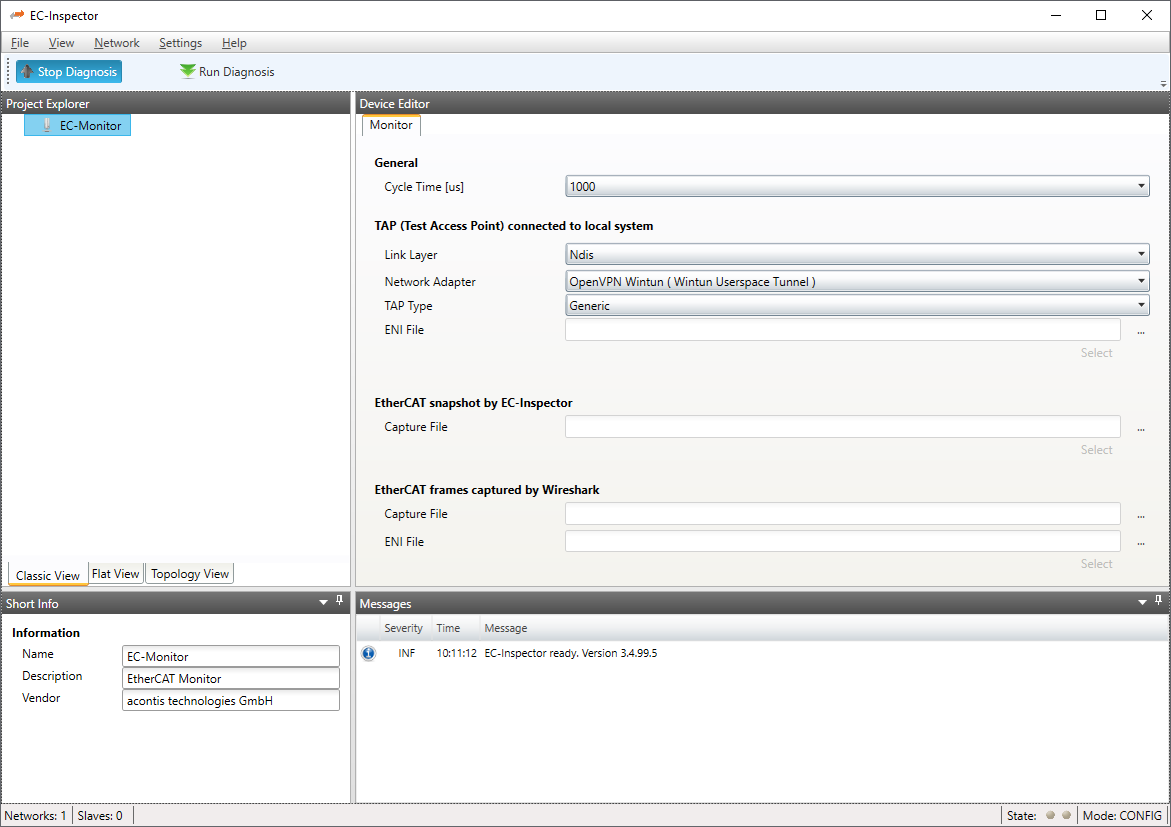
- At startup of EC-Monitor, the user will see this page:
4.2. Monitor Settings
4.2.1. Monitor
- In this tab, the user can configure the cycle time. If he wants to connect to a control system, this can also be configured. After one of these modes is selected, the ENI file will be imported to show the configuration:
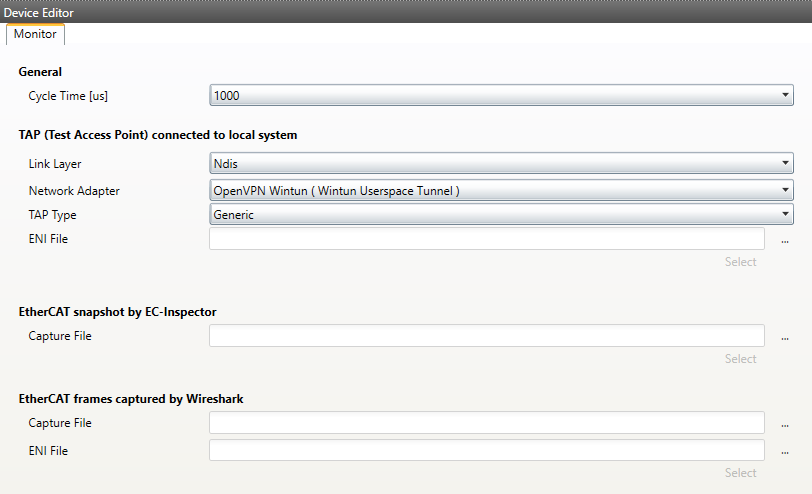
- General
- Cycle Time:
Interval in microseconds for the EC-Monitor.
- TAP connected to local system
- LinkLayer:
Select the Link-Layer which should be used.
- Network Adapter:
Network adapter which is connected to TAP or the switch.
- TAP Type:
Select the type of TAP adapter which is used. Generic is for a standard switch. Supported is also the ET2000. More will be supported in the future.
- ENI File:
Path to the ENI which is used in the network that should be monitored. The ENI file can be exported in EC-Engineer. More Infos about the ENI file from Third Party Masters can be found here Operating with Third Party EtherCAT Controller
- EtherCAT snapshot by EC-Inspector
- Capture File:
Path to the capture file, which contains one or more snapshots
ecd
For more information about the snapshots and capture files, see Capture File
- EtherCAT frames captured by Wireshark
- Capture File:
Path to the capture file
pcap- ENI File:
Path to the ENI which was used for the captured network.
For more information about the capture files, see Wireshark File
4.2.2. Process Data Image
- In this tab, the user can see all variables of the process data image.
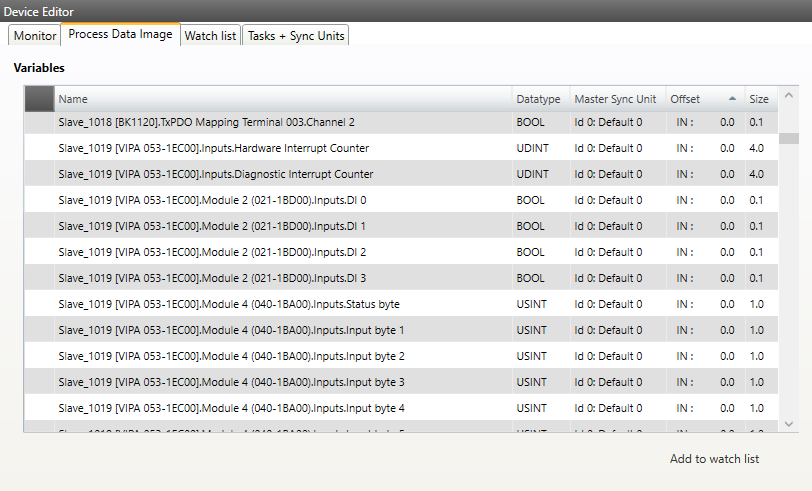
The variables can also be added to the watchlist, to have a better overview in diagnosis mode.
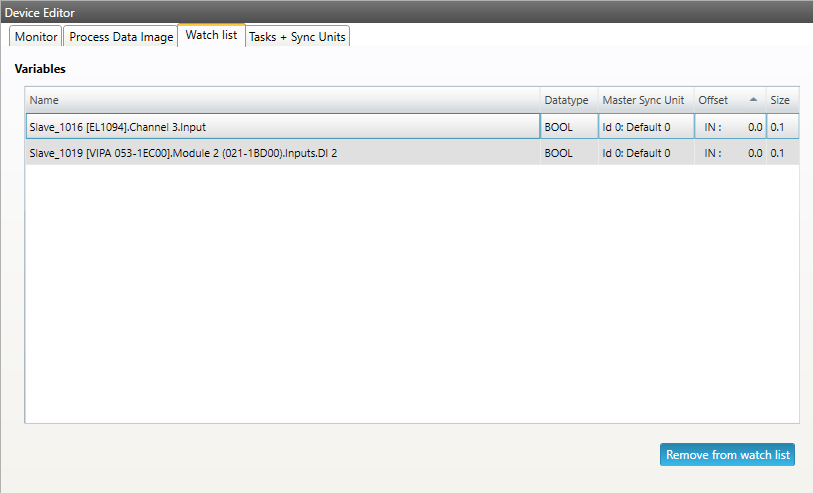
4.2.3. Watchlist Monitor
- In this tab, the user can see the watchlist and remove variables from the watchlist.
4.2.4. Tasks + Sync Units
- In this tab, the user can see the tasks and master sync units of the ENI file.
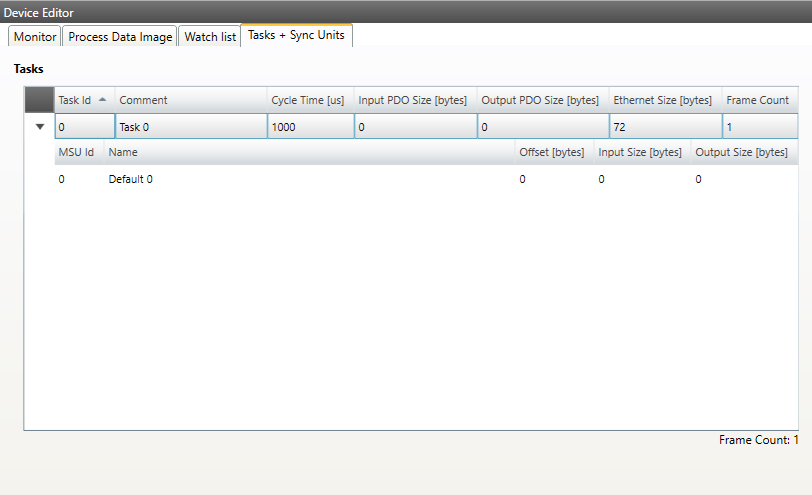
- Tasks:
List of cyclic tasks and master sync units.
4.2.5. Data Acquisition
In this tab, the user can configure our Data Acuisition (DAQ) library. This library can used from EC-Insepector to record process data in realtime.
- After adding a new recorder, the user can select the variables which should be recorded and specify some triggers:
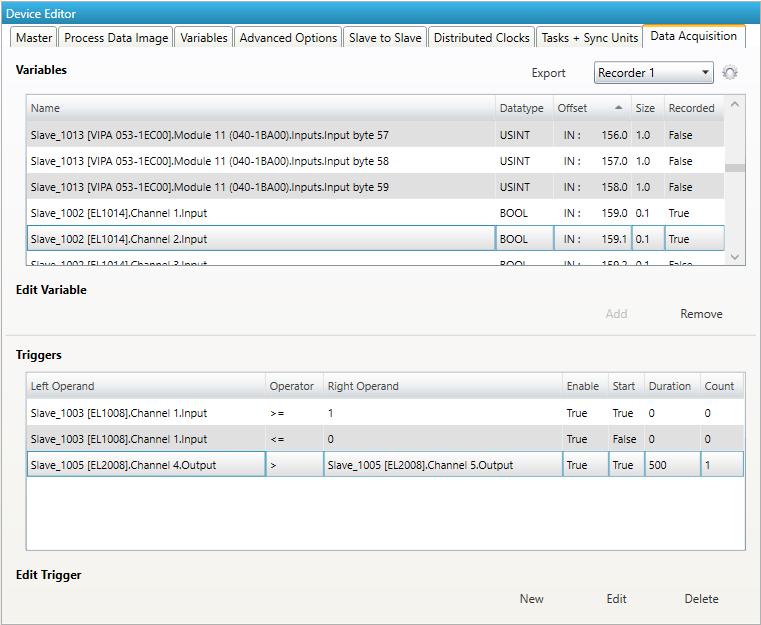
- Variables:
- Add/Remove:
Used for adding or removing the selected variable to the recording.
- Triggers:
- New/Edit/Delete:
Used for changing the trigger list.
- If user wants to edit a recorder, he will see the following dialog:
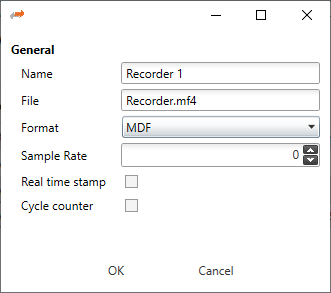
- Name:
Name of the recorder
- File:
Absolute path of the recorder file on the master system
- Format:
- Format of the recorder file, e.g.
MDF(Measurement Data Format)CSV(Comma Separated Values)
- Sample Rate:
Sample rate of the recorded data e.g. every cycle or every second cycle, …
- Real time stamp:
Adds a real time stamp to the recorded data
- Cycle counter:
Adds a cycle counter to the recorded data
- If user wants to edit a trigger, he will see the following dialog:
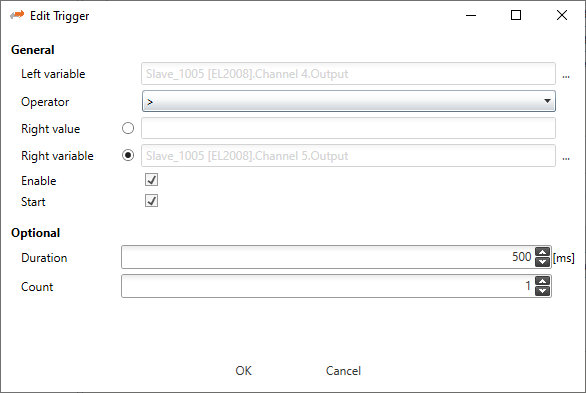
- General
- Left variable:
Name of the left variable
- Operator:
Operator of the trigger (e.g. =, >, >=, <, <=, !=)
- Right value:
Value of the right operand to compare the left variable against a static value e.g. trigger, if variable is greater than 5
- Right variable:
Name of the right variable to compare the left variable against the value of another variable e.g. trigger, if variable 1 is smaller than variable 2
- Enable:
Enabled or disabled trigger (can be enabled from application later)
- Start:
Start or stop trigger
- Optional
- Duration:
Duration in ms (0 = infinite) e.g. trigger should start recording for 500 ms
- Count:
Trigger count (0 = infinite) e.g. trigger should hit only for 5 times
For more information please refer the manual of the EC-Master-Data-Acquisition-Library.
4.2.6. Trigger
- In this tab, the user can create, edit und delete trigger. When a trigger is hit, the monitor will stop and show the actual state. Trigger can be created for process data and notifications. To switch to the notification trigger select the tab in top right corner.
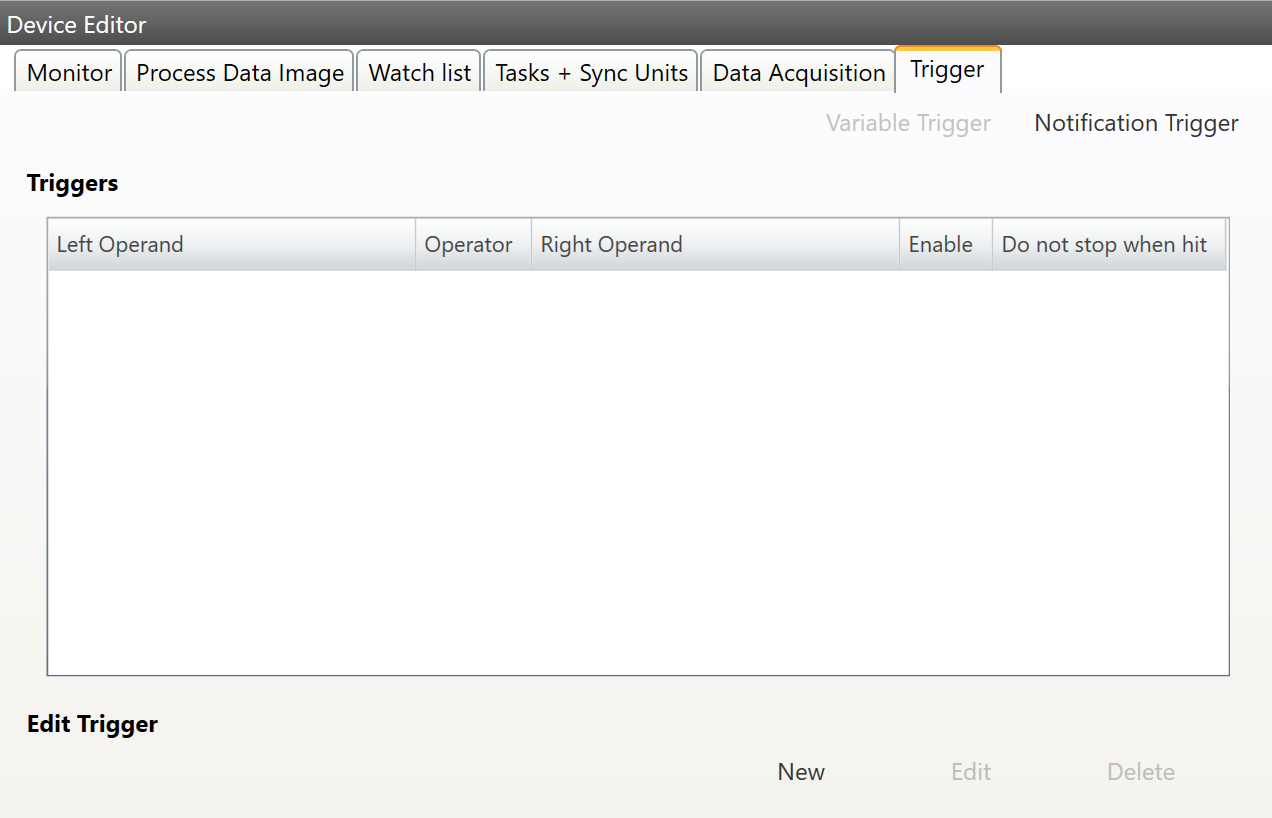
- Trigger:
List of trigger.
- Edit Trigger:
- New: When new is clicked the following dialog pops up:
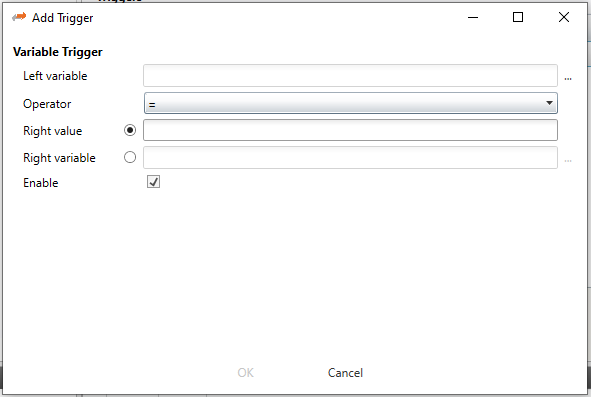
The user can select variable which should be compared and the select if he wants to compare with a value or another variable. With enable the trigger can be enababled and disabled.
- The following dialog pops up on the notification trigger tab:
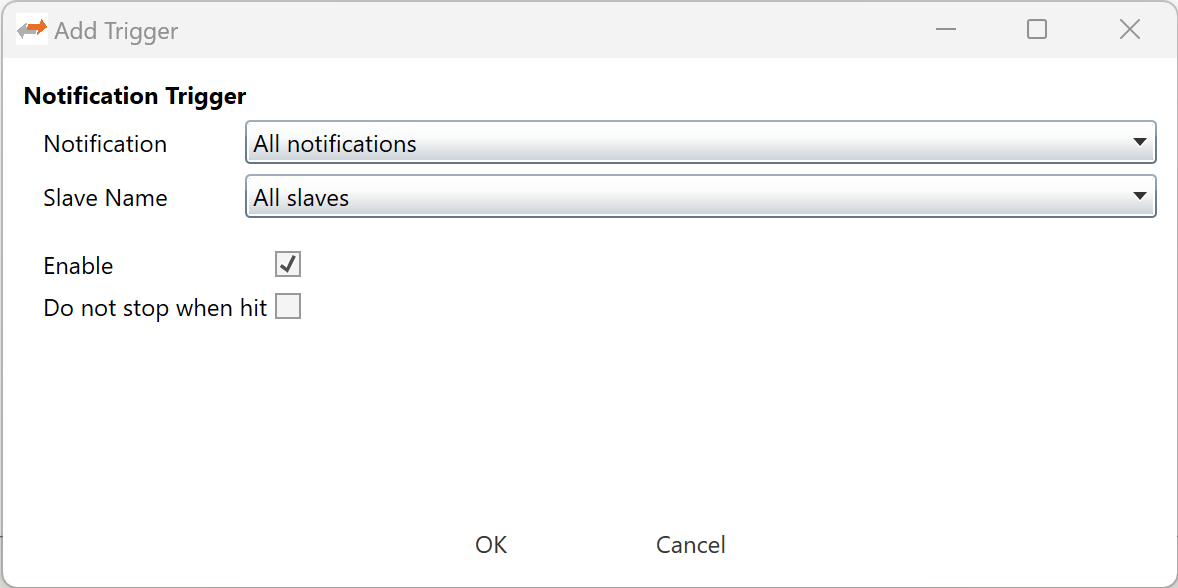
The user can select which notification should be triggered. He can also select for which slave the notification should be triggered. Default is “All slaves”. It is also possible to trigger all notifications for all slaves.
Edit: Edit the selected trigger
Delete: Remove the selected trigger from project
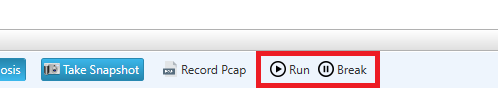
- If the EC-Inspector stops because of a trigger it can be restarted with Run. It is also possible to pause the EC-Inspector without a trigger:
4.3. Slave Settings
4.3.1. General
- In this tab, the user can see general slave settings like station address or the name of the slave. He can also see the connected ports.
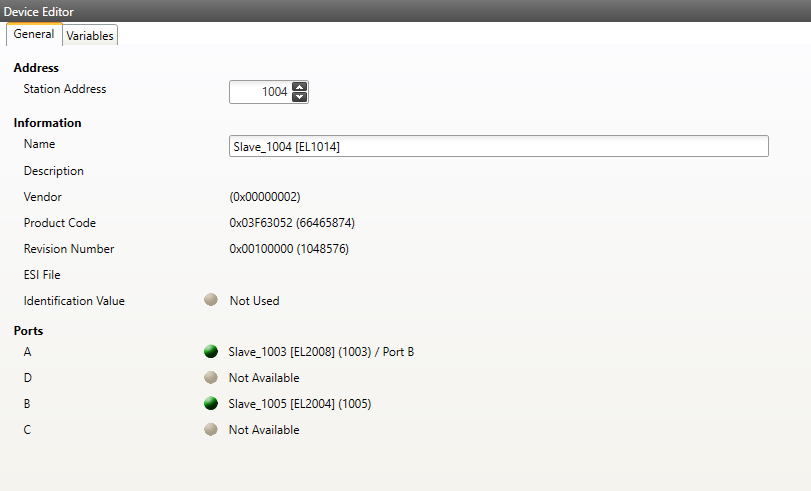
- Address
- Station Address:
Station address of the slave. By default, the first station address is 1001.
- Information
- Name:
Name of the slave. By default the following format is used “Slave_N [TYPE]”
- Vendor:
Name of the vendor the slave
- Product Code:
Product Code of the slave
- Revision Number:
Revision Number of the slave
- Identification Value:
Identification Value of the slave
- Ports
- Connected Devices:
List of connected devices
4.3.2. Variables
- In this tab, the user can see the variables of the slave.
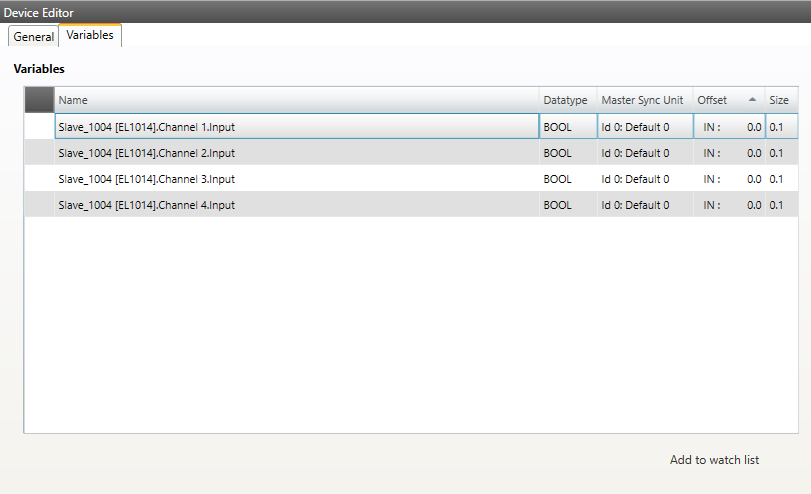
- Lists of Variables
Variables comes from the import of the ENI file.
- Buttons
- Add to watchlist:
Adds the variable into the watchlist