3. Graphical user interface
3.1. Overview
- This section gives an overview about the graphical user interface:
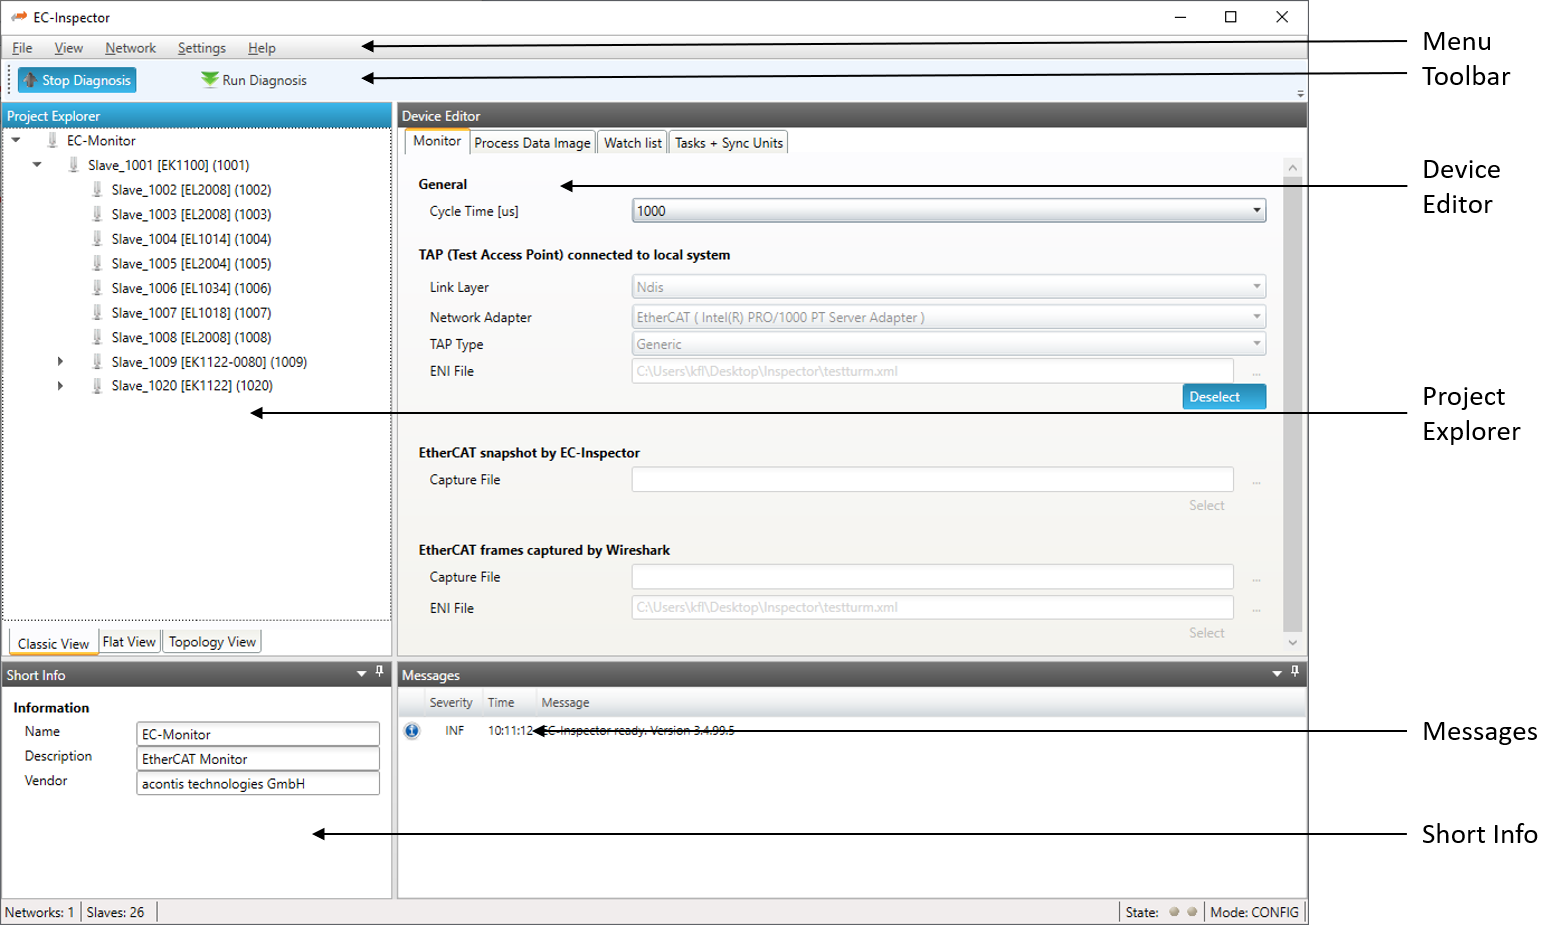
- The graphical user interface is divided into five parts:
- Menu/Tool/Status bar:
Shows current status or mode of the EC-Inspector and allows the user to change it.
- Project Explorer:
Shows different views of the current network when adding an ENI file or switching to diagnosis mode.
- Device Editor:
Show information about the selected device, like process variables. It allows the user to put them into a watchlist before switching to diagnosis mode.
- Short Info:
Show short information about selected device, like name, description or vendor.
- Messages:
Shows notifications which occur e.g. when the EC-Monitor hat detected a change in the topology or an error counter increased.
3.3. Project Explorer
3.3.1. Configuration Mode
There are three topology visualisation views:
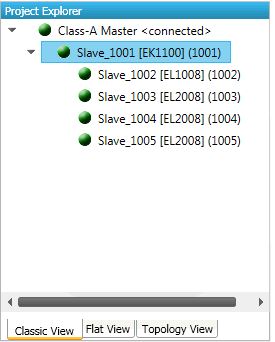
- Classic View
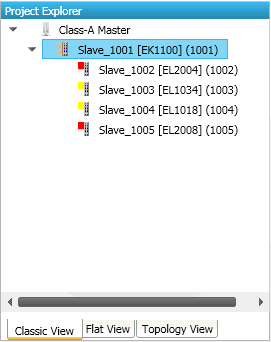
This is a tree view with multiple levels.
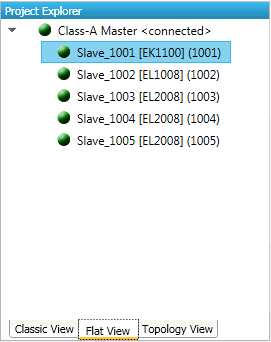
- Flat View
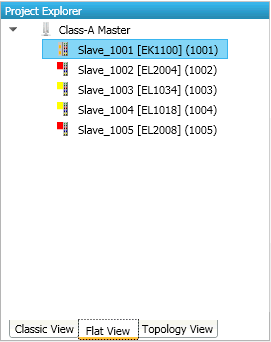
This view shows all slaves in a flat list, as they are connected in the EtherCAT network.
- Topology View
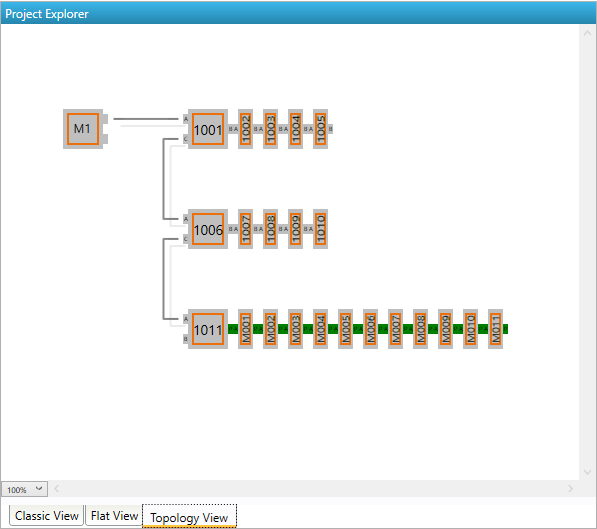
This view shows a graphical tree of all slaves, as they are connected in the EtherCAT network.
3.3.2. Diagnosis Mode
There are three topology visualisation views:
- Classic View
This is a tree view with multiple levels.
- Possible device states:
 Init Bootstrap
 Pre-Op
 Safe-Op
 Op
Op
- Flat View
This view shows all slaves in a flat list, as they are connected in the EtherCAT network.
- Possible device states:
- Init Bootstrap Pre-Op Safe-Op Op
- Topology View
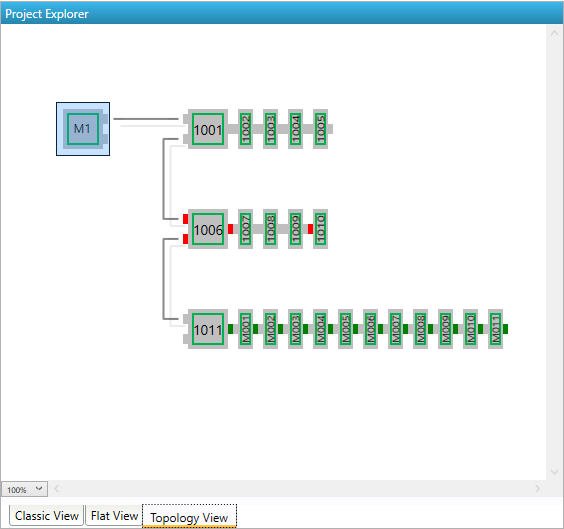
This view shows a graphical tree of all slaves, as they are connected in the EtherCAT network.
- Possible device states:
- Init Bootstrap Pre-Op Safe-Op Op
- Possible port states:
- Bad Cable Quality Constricted Cable Quality
 Good Cable Quality
If cable quality is constricted or bad, please check the error counters of the slave (for more information about the extended diagnosis, see Extended Diagnosis).
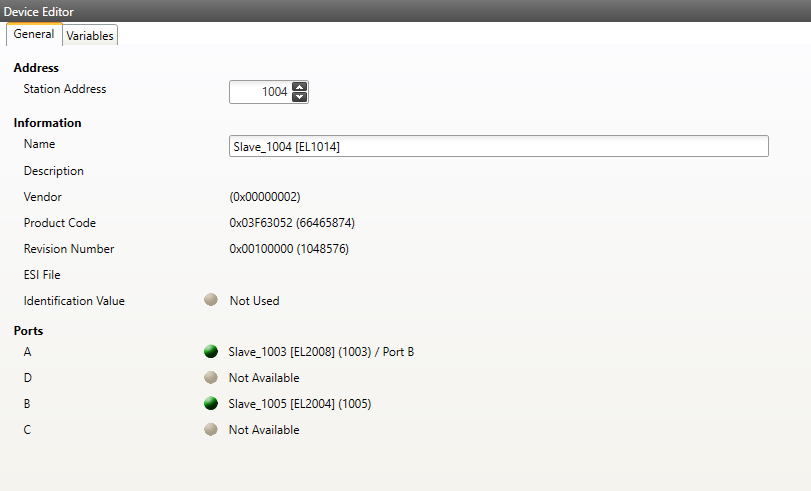
3.4. Device Editor
- This Editor gives the user the possibility to read information of the selected monitor or slave:
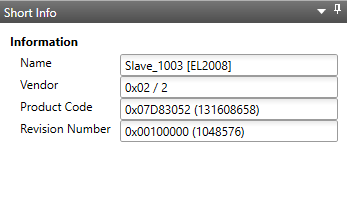
3.5. Short Info
- This window shows short information about selected device, like name, description or vendor:
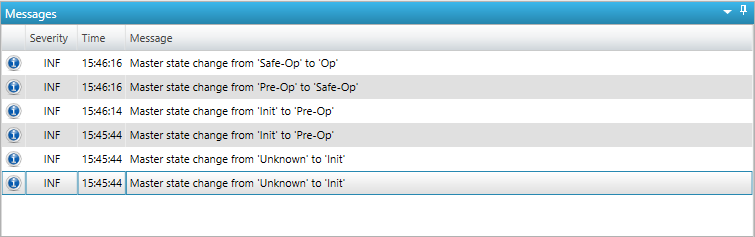
3.6. Message Window
- Shows notifications which occur e.g. when the EtherCAT Master has changed its operation state or a slave has been removed from (or added to) the EtherCAT network: