6.8. Performance Measurement
The acontis EC-Master software has a built-in performance measurement capability. This can be used to measure the execution times of the job functions that are called within the cyclic part of the application, as well as application specific functions. These executions times can be recorded both in form of overall statistics (min/avg/max) and in form of histograms.
6.8.1. Enabling performance measurements
Performance measurements need to be enabled inside the master init parms.
/* enable performance measurements */
oInitParms.PerfMeasInternalParms.bEnabled = EC_TRUE;

/* initialize the master */
dwRes = ecatInitMaster(&oInitParms);
See also
6.8.2. Retrieving overall performance statistics (min/avg/max)
Performance measurements in the example application can be activated using the command line parameter (-perf). It enables performance measurements and performance histograms as well. The resulting measurement values are recorded every few seconds to the log file, and printed to the console in the following format:
PerfMsmt 'JOB_ProcessAllRxFrames' (min/avg/max) [usec]:   12.5/  15.9/  25.6
PerfMsmt 'JOB_SendAllCycFrames  ' (min/avg/max) [usec]:    3.6/   5.7/  14.8
PerfMsmt 'JOB_MasterTimer       ' (min/avg/max) [usec]:    2.1/   3.7/   8.2
PerfMsmt 'JOB_SendAcycFrames    ' (min/avg/max) [usec]:    0.3/   0.6/   2.6
PerfMsmt 'Cycle Time            ' (min/avg/max) [usec]:  918.4/ 999.6/1067.9
PerfMsmt 'myAppWorkPd           ' (min/avg/max) [usec]:    0.1/   0.4/   0.8
PerfMsmt 'JOB_Total             ' (min/avg/max) [usec]:   19.0/  25.9/  39.2
In an application these values can be retrieved using the emPerfMeasInternalGet/emPerfMeasAppGet APIs. These APIs require the index of a measurement point. Note that the index of a particular measurement point is implementation defined and not the same in all versions. It should therefore be detected at runtime using emPerfMeasInternalGetInfo. The following example shows how measurements for JOB_ProcessAllRxFrames can be retrieved:
EC_T_DWORD dwProcessAllRxFramesIdx = 0;
EC_T_DWORD dwMeasNum = 0;
dwRes = ecatPerfMeasInternalGetNumOf(&dwMeasNum);

/* find index of perf measurement */
for (EC_T_DWORD i = 0; i < dwMeasNum; ++i)
{
    EC_T_PERF_MEAS_INFO PerfMeasInfo;
    dwRes = ecatPerfMeasInternalGetInfo(i, &PerfMeasInfo, 1);

    if (0 == OsStrncmp("JOB_ProcessAllRxFrames", PerfMeasInfo.szName, OsStrlen("JOB_ProcessAllRxFrames") + 1))
    {
        dwProcessAllRxFramesIdx = i;
        break;
    }
}

/* retrieve values */
EC_T_PERF_MEAS_VAL PerfMeasVal;
dwRes = ecatPerfMeasInternalGetRaw(dwProcessAllRxFramesIdx, &PerfMeasVal, EC_NULL, 1);
6.8.3. Recording performance histograms
In addition to the overall statistics described above it is possible to create a histogram of all results of a particular benchmark. The histogram has the following format:
/* enabling histograms */
EC_T_PERF_MEAS_COUNTER_PARMS* pHistParms = EC_NULL;
pHistParms = &oInitParms.PerfMeasInternalParms.HistogramParms;
/* amount of bins to use for the histogram */
pHistParms->dwBinCount = 1000;
/* range of the histograms.
 * - results below qwMinTicks are stored in the first bin
 * - results above qwMaxTicks are stored in the last bin
 *
 * a good starting point is the range 0 <-> 2 * the amount of ticks per cycle
 */
pHistParms->qwMinTicks = 0;
pHistParms->qwMaxTicks = 2 * qwTicksPerCycle;

/* initialize the master */
dwRes = ecatInitMaster(&oInitParms);
See also
Similar to the overall statistics it is possible to retrieve the histograms using emPerfMeasInternalGetRaw:
/* retrieve values */
EC_T_PERF_MEAS_HISTOGRAM PerfMeasHist;
PerfMeasHist.aBins = (EC_T_DWORD*)OsMalloc(dwBinCount * sizeof(EC_T_DWORD));
PerfMeasHist.dwBinCount = dwBinCount;
dwRes = ecatPerfMeasInternalGetRaw(dwProcessAllRxFramesIdx, EC_NULL, &PerfMeasHist, 1);
6.8.4. Special benchmark types
In addition to the normal benchmarks as described above, there are some special benchmark types which are flagged in EC_T_PERF_MEAS_INFO.
6.8.5. Application benchmarks
In addition to the internal benchmarks it is possible to create application specific benchmarks using the emPerfMeasApp API.
static EC_T_PERF_MEAS_INFO_PARMS S_aPerfMeasInfos[] =
{
    {"myBench", 0}
};
#define APPL_PERF_MEAS_NUM    (sizeof(S_aPerfMeasInfos) / sizeof(S_aPerfMeasInfos[0]))
#define PERF_myBench          0

EC_T_PERF_MEAS_APP_PARMS oPerfMeasAppParms;
OsMemset(&oPerfMeasAppParms, 0, sizeof(EC_T_PERF_MEAS_APP_PARMS));
oPerfMeasAppParms.dwNumMeas = APPL_PERF_MEAS_NUM;
oPerfMeasAppParms.aPerfMeasInfos = S_aPerfMeasInfos;

dwRes = ecatPerfMeasAppCreate( &oPerfMeasAppParms, EC_NULL);

ecatPerfMeasAppStart(EC_NULL, PERF_myBench);
/* benchmarked work */
ecatPerfMeasAppEnd(EC_NULL, PERF_myBench);
6.8.6. API
6.8.6.1. emPerfMeasAppCreate
-
static EC_T_DWORD ecatPerfMeasAppCreate(EC_T_PERF_MEAS_APP_PARMS *pPerfMeasAppParms, EC_T_VOID **ppvPerfMeas)
-
EC_T_DWORD emPerfMeasAppCreate(EC_T_DWORD dwInstanceID, EC_T_PERF_MEAS_APP_PARMS *pPerfMeasAppParms, EC_T_VOID **ppvPerfMeas)
Create PerfMeas object and bind it to the master instance.
This API can be called multiple times to create PerfMeas objects. The perfomance counters in each of the objects can be accessed in the following two ways:
by passing the PerfMeas object and the index of the performance measurement. The index ranges from [0-pPerfMeasAppParms->dwNumAppMeas]
by passing EC_NULL instead of a PerfMeas object and an index. In this case the index works across all PerfMeas objects bound to the master instance.
- Parameters
dwInstanceID – [in] Instance ID (Multiple EtherCAT Network Support)
pPerfMeasAppParms – [in] Pointer to parameter definitions
ppvPerfMeas – [out] Created PerfMeas object.
- Returns
EC_E_NOERROR or an error code
-
struct EC_T_PERF_MEAS_APP_PARMS
Public Members
-
EC_T_PERF_MEAS_INFO_PARMS *aPerfMeasInfos
[in] PerfMeasInfos associated with the corresponding benchmark
-
EC_T_PERF_MEAS_COUNTER_PARMS CounterParms
[in] Timer function settings. When not provided OsMeasGetCounterTicks is used
-
EC_T_PERF_MEAS_HISTOGRAM_PARMS HistogramParms
[in] Histogram settings. When not provided the histogram is disabled.
-
EC_T_PERF_MEAS_INFO_PARMS *aPerfMeasInfos
6.8.6.2. emPerfMeasAppDelete
-
EC_T_DWORD emPerfMeasAppDelete(EC_T_DWORD dwInstanceID, EC_T_VOID *pvPerfMeas)
Delete application performance measurement and unbind it from the master instance.
Objects which are not deleted using PerfMeasAppDelete are automatically deleted when calling DeinitMaster.
Note
This invalidates the global index used when passing EC_NULL into the other PerfMeasApp functions
- Parameters
dwInstanceID – [in] Instance ID (Multiple EtherCAT Network Support)
pvPerfMeas – [in] PerfMeas object to delete
- Returns
EC_E_NOERROR or an error code
6.8.6.3. emPerfMeasAppStart
-
EC_T_DWORD emPerfMeasAppStart(EC_T_DWORD dwInstanceID, EC_T_VOID *pvPerfMeas, EC_T_DWORD dwIndex)
Start application performance measurement.
- Parameters
dwInstanceID – [in] Instance ID (Multiple EtherCAT Network Support)
pvPerfMeas – [in] PerfMeas object or EC_NULL to use continuous index
dwIndex – [in] Index of the performance measurement
- Returns
EC_E_NOERROR or an error code
6.8.6.4. emPerfMeasAppEnd
-
EC_T_DWORD emPerfMeasAppEnd(EC_T_DWORD dwInstanceID, EC_T_VOID *pvPerfMeas, EC_T_DWORD dwIndex)
Stop application performance measurement.
- Parameters
dwInstanceID – [in] Instance ID (Multiple EtherCAT Network Support)
pvPerfMeas – [in] PerfMeas object or EC_NULL to use continuous index
dwIndex – [in] Index of the performance measurement
- Returns
EC_E_NOERROR or an error code
6.8.6.5. emPerfMeasAppReset
-
EC_T_DWORD emPerfMeasAppReset(EC_T_DWORD dwInstanceID, EC_T_VOID *pvPerfMeas, EC_T_DWORD dwIndex)
Reset application performance measurement.
- Parameters
dwInstanceID – [in] Instance ID (Multiple EtherCAT Network Support)
pvPerfMeas – [in] PerfMeas object or EC_NULL to use continuous index
dwIndex – [in] Index of the performance measurement, use EC_PERF_MEAS_ALL to reset all
- Returns
EC_E_NOERROR or an error code
6.8.6.6. emPerfMeasAppGetNumOf
-
EC_T_DWORD emPerfMeasAppGetNumOf(EC_T_DWORD dwInstanceID, EC_T_VOID *pvPerfMeas, EC_T_DWORD *pdwNumOf)
Reset number of application performance measurement.
- Parameters
dwInstanceID – [in] Instance ID (Multiple EtherCAT Network Support)
pvPerfMeas – [in] PerfMeas object or EC_NULL to get the number of performance measurements in all PerfMeas objects
pdwNumOf – [out] Number of performance measurements
- Returns
EC_E_NOERROR or an error code
6.8.6.7. emPerfMeasAppGetInfo
-
static EC_T_DWORD ecatPerfMeasAppGetInfo(EC_T_VOID *pvPerfMeas, EC_T_DWORD dwIndex, EC_T_PERF_MEAS_INFO *pPerfMeasInfo, EC_T_DWORD dwPerfMeasNumOf)
-
EC_T_DWORD emPerfMeasAppGetInfo(EC_T_DWORD dwInstanceID, EC_T_VOID *pvPerfMeas, EC_T_DWORD dwIndex, EC_T_PERF_MEAS_INFO *pPerfMeasInfo, EC_T_DWORD dwPerfMeasNumOf)
Get general info about one/all application performance measurement.
- Parameters
dwInstanceID – [in] Instance ID (Multiple EtherCAT Network Support)
pvPerfMeas – [in] PerfMeas object or EC_NULL to use continous index
dwIndex – [in] Index of the performance measurement information, use EC_PERF_MEAS_ALL to get all
pPerfMeasInfo – [out] Pointer to a buffer receiving one/all performance measurement information
dwPerfMeasNumOf – [in] Number of elements allocated in pPerfMeasInfo
- Returns
EC_E_NOERROR or an error code
-
struct EC_T_PERF_MEAS_INFO
Public Members
-
EC_T_USER_JOB eUserJob
UserJob associated with the benchmark
-
EC_T_USER_JOB eUserJob
6.8.6.8. emPerfMeasAppGetRaw
-
static EC_T_DWORD ecatPerfMeasAppGetRaw(EC_T_VOID *pvPerfMeas, EC_T_DWORD dwIndex, EC_T_PERF_MEAS_VAL *pPerfMeasVal, EC_T_PERF_MEAS_HISTOGRAM *pPerfMeasHistogram, EC_T_DWORD dwPerfMeasNumOf)
-
EC_T_DWORD emPerfMeasAppGetRaw(EC_T_DWORD dwInstanceID, EC_T_VOID *pvPerfMeas, EC_T_DWORD dwIndex, EC_T_PERF_MEAS_VAL *pPerfMeasVal, EC_T_PERF_MEAS_HISTOGRAM *pPerfMeasHistogram, EC_T_DWORD dwPerfMeasNumOf)
Get raw data of one/all application performance measurement.
- Parameters
dwInstanceID – [in] Instance ID (Multiple EtherCAT Network Support)
pvPerfMeas – [in] PerfMeas object or EC_NULL to use continuous index
dwIndex – [in] Index of the performance measurement, use EC_PERF_MEAS_ALL to get all
pPerfMeasVal – [out] Pointer to a buffer receiving one/all performance measurement values or EC_NULL
pPerfMeasHistogram – [out] Pointer to a buffer receiving one/all performance measurement histograms or EC_NULL
dwPerfMeasNumOf – [in] Number of elements allocated in pPerfMeasVal and pPerfMeasHistogram
- Returns
EC_E_NOERROR or an error code
-
struct EC_T_PERF_MEAS_HISTOGRAM
Public Members
-
EC_T_DWORD *aBins
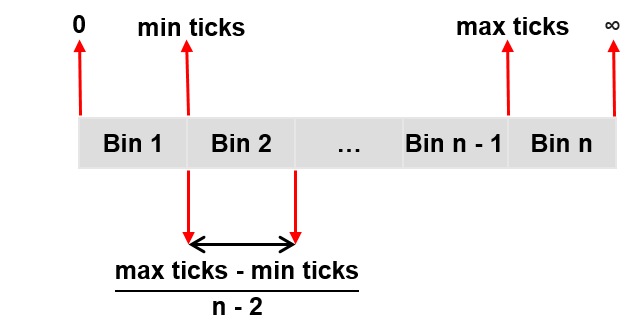
Histogram Bins:
The first bin is used for times below
dwMinTicks. The last bin is used for times equal and abovedwMaxTicks. All other times are stored indwBinCount - 2bins of equal size.
With e.g. dwBinCount = 202
qwMinTicks corresponding to 500us
qwMaxTicks corresponding to 1500us
aBins[0]: (-inf, 500us) corresponds to -inf < x < 500us
aBins[1]: [500us, 505us) corresponds to 500us <= x < 505us
aBins[2]: [505us, 510us) corresponds to 505us <= x < 510us
…
aBins[199]: [1490us, 1495us) corresponds to 1490us <= x < 1495us
aBins[200]: [1495us, 1500us) corresponds to 1495us <= x < 1500us
aBins[201]: [1500us, inf+) corresponds to 1500us <= x < inf+
-
EC_T_DWORD *aBins
6.8.6.9. emPerfMeasInternalResetByTaskId
-
EC_T_DWORD emPerfMeasInternalResetByTaskId(EC_T_DWORD dwInstanceID, EC_T_DWORD dwTaskId, EC_T_DWORD dwIndex)
Reset internal performance measurement.
- Parameters
dwInstanceID – [in] Master Instance ID
dwTaskId – [in] Task Job ID
dwIndex – [in] Index of the performance measurement, use EC_PERF_MEAS_ALL to reset all
- Returns
EC_E_NOERROR or an error code
6.8.6.10. emPerfMeasInternalGetNumOfByTaskId
-
EC_T_DWORD emPerfMeasInternalGetNumOfByTaskId(EC_T_DWORD dwInstanceID, EC_T_DWORD dwTaskId, EC_T_DWORD *pdwNumOf)
Reset number of internal performance measurement.
- Parameters
dwInstanceID – [in] Master Instance ID
dwTaskId – [in] Task Job ID
pdwNumOf – [out] Number of performance measurements
- Returns
EC_E_NOERROR or an error code
6.8.6.11. emPerfMeasInternalGetInfoByTaskId
-
static EC_T_DWORD ecatPerfMeasInternalGetInfoByTaskId(EC_T_DWORD dwTaskId, EC_T_DWORD dwIndex, EC_T_PERF_MEAS_INFO *pPerfMeasInfo, EC_T_DWORD dwPerfMeasNumOf)
-
EC_T_DWORD emPerfMeasInternalGetInfoByTaskId(EC_T_DWORD dwInstanceID, EC_T_DWORD dwTaskId, EC_T_DWORD dwIndex, EC_T_PERF_MEAS_INFO *pPerfMeasInfo, EC_T_DWORD dwPerfMeasNumOf)
Get general info about one/all internal performance measurement.
- Parameters
dwInstanceID – [in] Master Instance ID
dwTaskId – [in] Task Job ID
dwIndex – [in] Index of the performance measurement, use EC_PERF_MEAS_ALL to get all
pPerfMeasInfo – [out] Pointer to a buffer receiving one/all performance measurement infos
dwPerfMeasNumOf – [in] Number of elements allocated in pPerfMeasInfo
- Returns
EC_E_NOERROR or an error code
6.8.6.12. emPerfMeasInternalGetRawByTaskId
-
static EC_T_DWORD ecatPerfMeasInternalGetRawByTaskId(EC_T_DWORD dwTaskId, EC_T_DWORD dwIndex, EC_T_PERF_MEAS_VAL *pPerfMeasVal, EC_T_PERF_MEAS_HISTOGRAM *pPerfMeasHistogram, EC_T_DWORD dwPerfMeasNumOf)
-
EC_T_DWORD emPerfMeasInternalGetRawByTaskId(EC_T_DWORD dwInstanceID, EC_T_DWORD dwTaskId, EC_T_DWORD dwIndex, EC_T_PERF_MEAS_VAL *pPerfMeasVal, EC_T_PERF_MEAS_HISTOGRAM *pPerfMeasHistogram, EC_T_DWORD dwPerfMeasNumOf)
Get raw data of one/all application performance measurement.
- Parameters
dwInstanceID – [in] Master Instance ID
dwTaskId – [in] Task Job ID
dwIndex – [in] Index of the performance measurement, use EC_PERF_MEAS_ALL to get all
pPerfMeasVal – [out] Pointer to a buffer receiving one/all performance measurement values or EC_NULL
pPerfMeasHistogram – [out] Pointer to a buffer receiving one/all performance measurement histograms or EC_NULL
dwPerfMeasNumOf – [in] Number of elements allocated in pPerfMeasVal and pPerfMeasHistogram
- Returns
EC_E_NOERROR or an error code